What is Luxury?
Luxury can be difficult to define when it comes to housing. The million-dollar price point used to be one of the defining points for classifying a luxury home, but that’s not always the case. While the million-dollar price point is a significant benchmark, the offerings vary widely across the country. Many times, luxury can come down to just passing an eye test, and you know it when you see it. This is where price percentiles come into play.
We have three distinct segments for the overall luxury market. The 90th percentile, or the top 10% of homes by price, is the starting point where we get into the entry point for luxury. This takes into account how expensive the top tier of the homes is and the general environment. For example, in the San Jose metro, the median home costs around $1.4 million, while the top 10% of homes start near $3.5 million; while in the Pittsburgh metro, the top 1% of homes start just over $2.3 million. In fact, in Pittsburgh, the top 10% of homes start around $680k, meaning you can get a luxury home for well under the million-dollar mark.
There are trade-offs that come with each area; higher-priced metros typically have strong economic engines that drive up demand for homes, desirable landscapes, proximity to water, and more. An area’s maturity and land availability also play a significant role. Some parts of the country can continue to build out with abundant land, while others face strict zoning restrictions, limited space due to geographic constraints, or older markets that have built out to their limits. The factors vary widely, and each plays a vital role in the price point of homes in an area.
The general tiers of luxury are designated as entry (top 10%), high-end (top 5%), and ultraluxury (top 1%). However, within these tiers are multiple levels of luxury. We will break down the 7 levels of luxury found throughout the country. From level 1 to level 7, there are no losers in this ranking. Each level offers its own distinct advantages at its price point.
The National Baseline
Before getting into the levels, here is where the national luxury market stands as of May 2026. Before the pandemic-era demand surge, a million-dollar home was in the nationwide top 10% of homes. As of May 2026, it takes closer to $1.28 million to reach that threshold, and the share of listings priced above $1 million stands at 13.8%, higher than the pre-pandemic range of 9.0%. These benchmarks are the reference point for every comparison that follows.
| Median Listing Price | $430K |
| Luxury Threshold 90th Percentile | $1.28M |
| High-End Luxury Threshold 95th Percentile | $2.0M |
| Ultra Luxury Threshold 99th Percentile | $5.57M |
| Million-Dollar Listing Share | 13.8% |
| Median Square Feet $1- $2 Million | 2,986 |
Nationally, the 90th-percentile threshold sits at roughly $1.28 million, just over 3 times the national median listing price of $430K. That ratio is the baseline. In some markets, luxury starts at 2x the local median. In others, it stretches past 17x. Both are luxury. They are just different levels.
Level 1
The Space Play – Regional Hubs

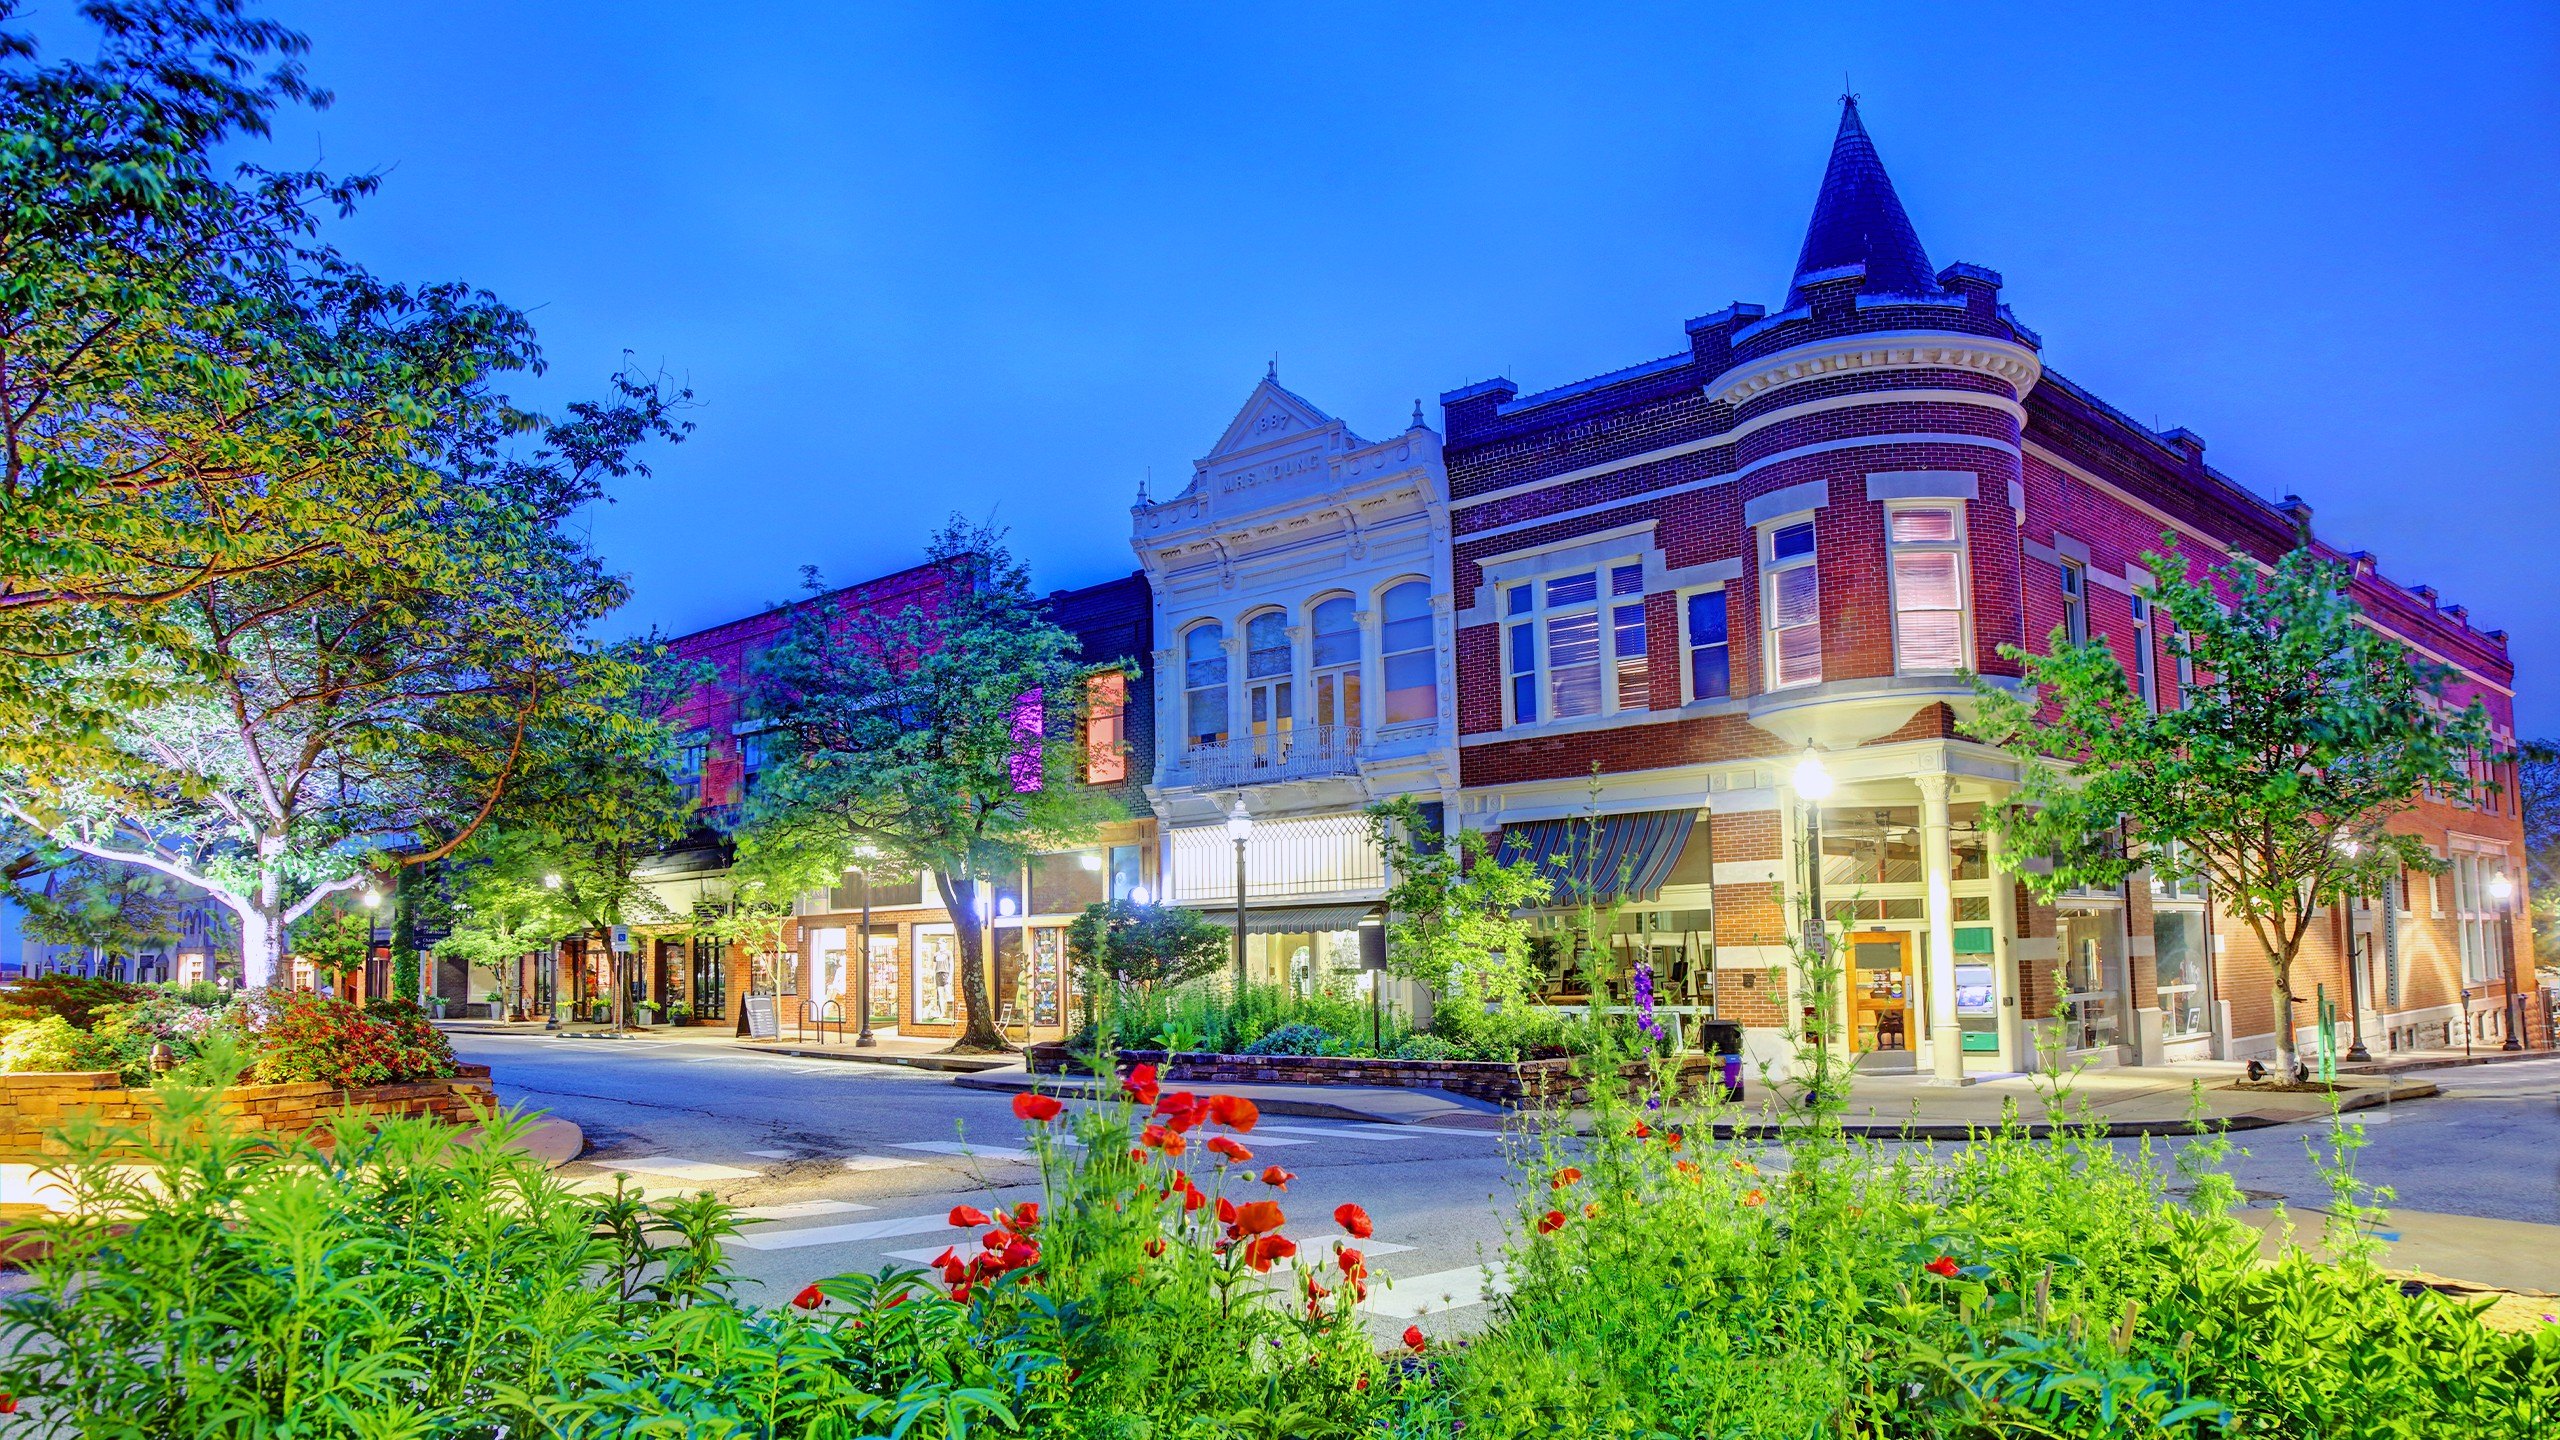
Huntsville Alabama USA park and downtown cityscape – Getty Images
The Space Play is the first level of luxury. Having space is not exclusive to luxury homes, but these are areas where you can typically have more space, in addition to the local amenities offered. The space play can also elicit reactions from some who think “but who would want to live all the way out there?” In short, you get more for your money and higher-end finishes, but there is a trade-off. More established areas typically offer larger economic engines, big-city amenities, and greater convenience. Many of these homes could sell for more than double the price if they were in a larger metro area.
The Level 1 areas are regional hubs where the entry point to the top 10% of homes falls below the million-dollar mark. Median square footage for $1 million to $2 million homes often exceeds 2,800 square feet, with newer construction and premium finishes that reflect how far a dollar goes when land is not the scarcest thing in the equation. The handful of multimillion-dollar homes offer vast estates, quiet neighborhoods, and sometimes access to water, such as lakes and rivers. These might be farther from a major city center or coastal access, but for some, that’s the point.
A common characteristic for this level is the presence of one or two major anchors that employ a large portion of the local population. A flagship university, a major hospital system, a military installation, or a dominant regional employer creates a steady base of high-income households that sustains demand for upper-tier housing without the broader economic pressures that drive prices in larger metros.
These anchors also draw in people who would never have considered the area if it were not for a job relocation. That pattern deepens the local buyer pool over time and keeps the luxury tier more active than the market’s size might otherwise suggest.
(Data Characteristics: Million-Dollar Property Counts under 250, 90th percentile under $1 million)
Example Markets:
- Huntsville, AL: One of the clearest examples of the anchor dynamic at work. A dense cluster of aerospace and defense contractors has created a concentration of high-income engineers. The result is a luxury tier that punches well above its population weight, with larger homes at price points that would be a fraction of what comparable properties cost near equivalent employers in other markets.
- Lincoln, NE: A regional state capital with a stable economic base. Luxury homes here offer more space per dollar than virtually any comparable metro.
- Rochester, MN: Anchored by a major medical institution with a strong high-income professional base and land availability that keeps the luxury tier well-stocked and relatively affordable.
- Chattanooga, TN: A market where outdoor recreation, a growing creative economy, and anchors including the Tennessee Aquarium and major manufacturing employers like Volkswagen keep the upper tier accessible. The area is considered one of the most important logistics hubs in the country. Scenic mountain and river access gives the luxury market a lifestyle dimension that is rare at this price point.
- Amarillo, TX: Wide-open Texas land keeps the luxury floor well below the national benchmark, with newer construction making up a meaningful share of the top-tier inventory.
| Area | Geo Type | Median Listing | Million Dollar Listing Share | Million Dollar Listing Count | Median SqFt $1 – $2 Million | 90th Percentile Listing Price | 95th Percentile Listing Price | 99th Percentile Listing Price |
| Huntsville, AL | Metro | $376K | 3.8% | 114 | 4,387 | $759K | $946K | $1.47M |
| Lincoln, NE | Metro | $419K | 5.2% | 45 | 4,601 | $800K | $1.00M | $1.83M |
| Rochester, MN | Metro | $425K | 9.2% | 58 | 4,358 | $906K | $1.24M | $2.24M |
| Chattanooga, TN-GA | Metro | $400K | 7.8% | 224 | 3,700 | $875K | $1.30M | $2.62M |
| Amarillo, TX | Metro | $318K | 4.4% | 33 | 4,120 | $749K | $984K | $1.73M |
Level 2
Emerging Markets
Fayetteville, Arkansas – Getty Images
Emerging Markets blend aspects of the space play, but these areas have received more attention over the years, especially post-pandemic. You still typically get more for your money here, and there is likely also a significant draw that has driven the market’s rapid growth over the last few years. The growth in emerging markets can come from major corporate headquarters, expanding research centers, or renewed attention to markets as vacation destinations.
Luxury here typically breaks the million-dollar mark but remains below the national threshold of $1.28 million. These emerging markets typically have newer construction and have seen large increases in million-dollar listings over the last 5 years. New construction accounts for a substantial share of luxury listings in several of these metros, reflecting how much of the luxury segment is purpose-built to meet demand rather than drawn from an existing stock of older homes.
Fayetteville-Springdale-Rogers, AR, is a strong example with growth driven by major corporate headquarters and a logistics corridor. Although newer construction is a common characteristic at this level, another trend is older metros that have seen renewed interest and are often seen as more affordable alternatives to pricier locations such as Savannah, GA.
(Data Characteristics: Million-dollar-plus listing counts over the past 12 months between 200 and 500, median listing price below $1 million, and the 90th percentile listing price at or approaching $1 million)
Example Markets:
- Fayetteville-Springdale-Rogers, AR: Over 30% year-over-year growth in million-dollar listings, with 41.3% of luxury inventory being new construction. The luxury entry point of roughly $1.02 million still sits below the national floor.
- Durham-Chapel Hill, NC: The Research Triangle’s luxury ascent, with 23.7% growth in million-dollar listings and a 16.1% luxury share. Both anchor universities and continued corporate relocation have created a sustained pipeline of high-income households entering the local market.
- Colorado Springs, CO: 17.8% year-over-year growth in luxury listings, with the 90th-percentile threshold crossing the million-dollar mark, supported by a combination of military presence, including the Air Force Academy, tech expansion, and lifestyle demand.
- Knoxville, TN: A flagship university market actively building a luxury tier, with 16.0% growth in million-dollar listings.
- Savannah, GA: A coastal market with historic character with several higher educational institutions that has drawn renewed attention, with lifestyle and vacation-property demand propping up its luxury profile.
| Area | Geo Type | Median Listing | Million Dollar Listing Share | Million Dollar Listing Count | Median SqFt $1 – $2 Million | 90th Percentile Listing Price | 95th Percentile Listing Price | 99th Percentile Listing Price |
| Fayetteville-Rogers, AR | Metro | $459K | 11.3% | 362 | 3,678 | $1.08M | $1.50M | $2.95M |
| Durham-Chapel Hill, NC | Metro | $489K | 16.1% | 323 | 3,930 | $1.25M | $1.75M | $3.30M |
| Colorado Springs, CO | Metro | $498K | 10.0% | 353 | 4,469 | $998K | $1.34M | $2.38M |
| Knoxville, TN | Metro | $460K | 11.1% | 357 | 3,886 | $1.08M | $1.49M | $3.24M |
| Savannah, GA | Metro | $410K | 10.3% | 250 | 3,201 | $996K | $1.50M | $3.49M |
Level 3
Established Metro
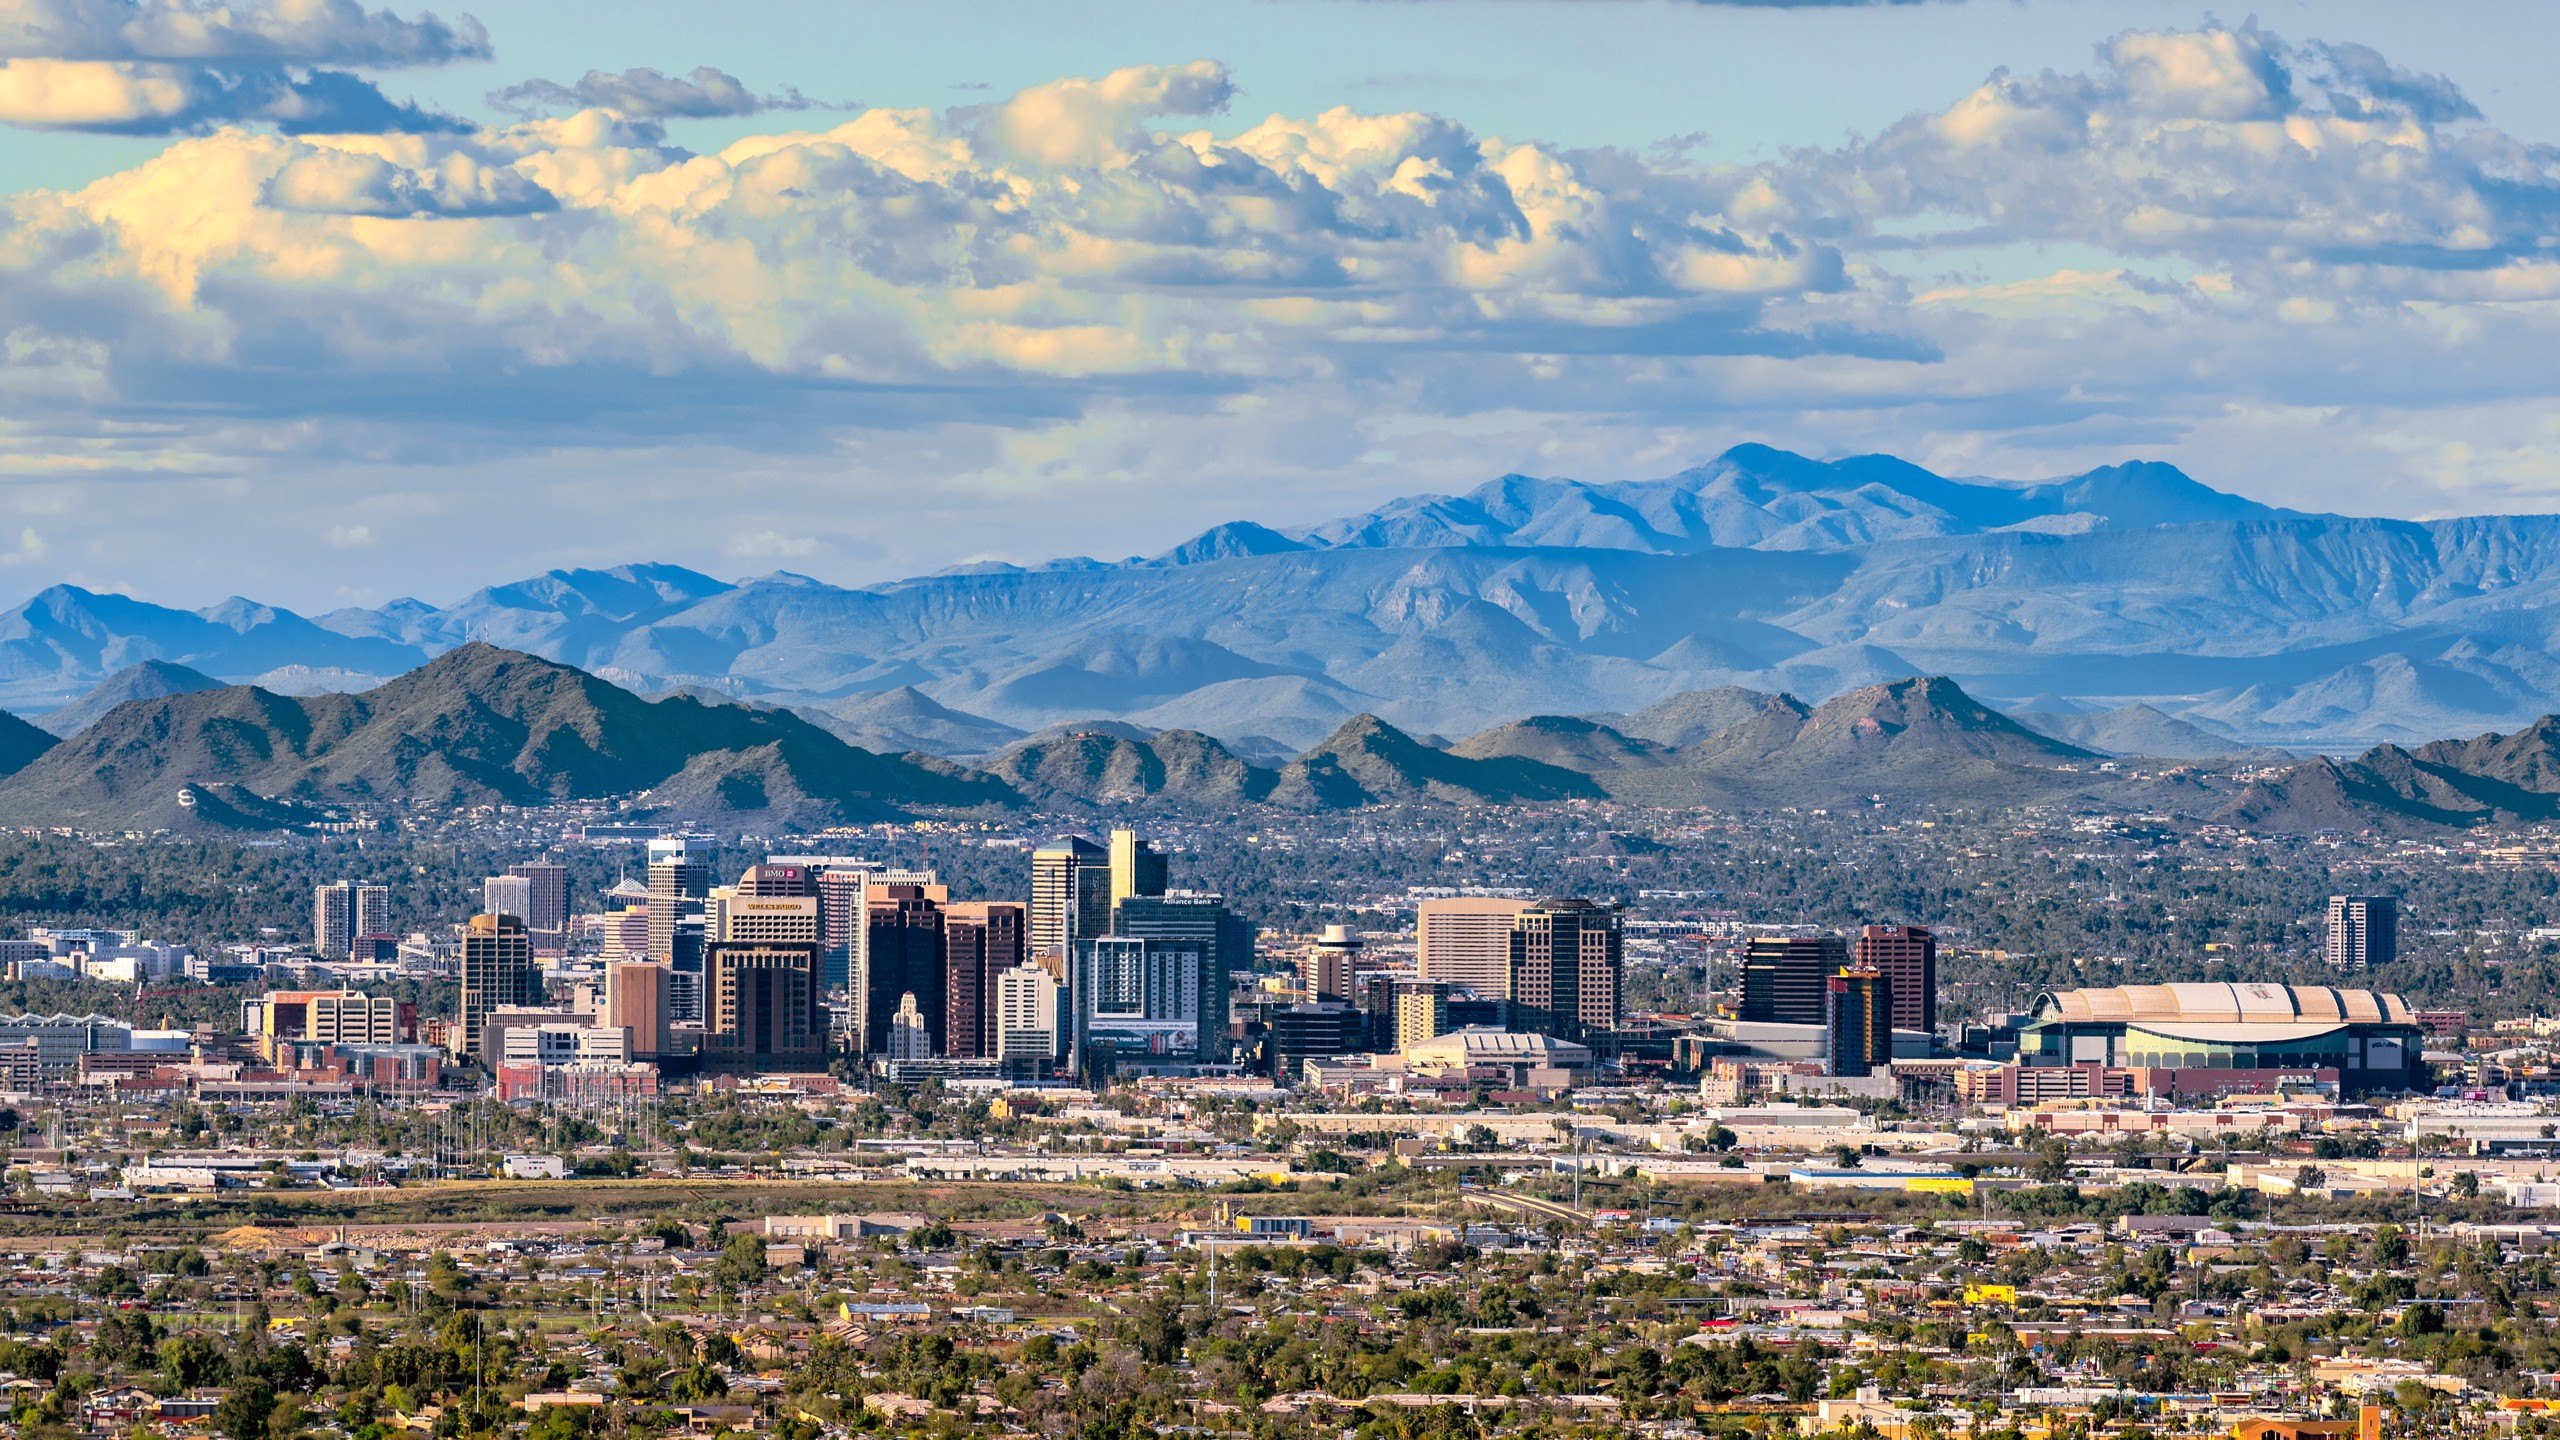
Phoenix, Arizona skyline
Established metros have the widest range of offerings. These are areas that are well known, and you get access to major city amenities that can come at a cost, but you can also find metros that can still give you more space for your money or access to luxury at a lower price point.
In these areas, you’ll often find that the more mature neighborhoods come at more of a premium, but there seems to be a new neighborhood popping up on the outskirts every other month. Traffic becomes a consideration with commutes, but it may not be a dealbreaker just yet.
These areas still have a high number of million-dollar listings, but luxury can be had for below the million-dollar mark, especially if you are okay with being slightly outside the city center. The defining characteristic of Level 3 is that luxury does not feel detached from the broader market. The gap between the median home and the entry-level luxury threshold in these metros tends to be narrow, often just 2.2x to 2.3x, compared to the national 3.0x.
The Atlanta metro is a great example of an established metro that offers more space for your money in the $1 to $2 million tier, while also having depth, with over 2,700 million-dollar listings and a 99th-percentile price of $3.2 million; there is a range of luxury options.
(Data Characteristics: Million-dollar-plus listings over the past 12 months are over 500, 90th percentile listing price below $1.5 million)
Example Markets:
- Atlanta-Sandy Springs, GA: One of the national leaders in square footage per dollar at the $1M to $2M price point at 4,677 square feet, with a luxury entry at $994K that is 2.3x the local median.
- Dallas-Fort Worth, TX: Averaging over 2,700 million-dollar monthly listings and a luxury entry just below $1 million, with 4,027 median square feet for $1M to $2M homes.
- Phoenix-Mesa-Chandler, AZ: Has some of the most exclusive ZIP codes with Scottsdale and Paradise Valley, but also offers more approachable options on the outer layers of the valley.
- Las Vegas-Henderson, NV: A market that retained 81.6% of its pandemic-era run-up, among the stronger showings for a metro of its size, sustained by a constant flow of tourism, hospitality employment, and a growing professional base. No state income tax adds a financial dimension that draws high-income relocators from California and the Northeast, keeping demand at the top of the market elevated even as national luxury has softened.
- Orlando, FL: One of the tightest luxury-to-median ratios in the country at 2.1x, reflecting a high-end market where homes are often differentiated by size and amenities rather than location alone.
| Area | Geo Type | Median Listing | Million Dollar Listing Share | Million Dollar Listing Count | Median SqFt $1 – $2 Million | 90th Percentile Listing Price | 95th Percentile Listing Price | 99th Percentile Listing Price |
| Atlanta-Sandy Springs, GA | Metro | $425K | 9.8% | 2,708 | 4,669 | $994K | $1.45M | $3.20M |
| Dallas-Fort Worth, TX | Metro | $436K | 10.7% | 3,006 | 4,080 | $1.06M | $1.65M | $4.19M |
| Phoenix-Mesa-Chandler, AZ | Metro | $498K | 16.5% | 3,215 | 3,180 | $1.45M | $2.50M | $6.56M |
| Las Vegas-Henderson, NV | Metro | $475K | 12.7% | 1,246 | 3,563 | $1.20M | $2.06M | $5.93M |
| Orlando-Kissimmee-Sanford, FL | Metro | $420K | 8.4% | 1,121 | 3,630 | $923K | $1.40M | $3.49M |
Level 4
Access Trade-Off & Rapid Growth

New York City Skyline – Getty Images
At Level 4, you are finding areas where you have to make a trade-off between space and access to hubs that drive national and global commerce. This level also includes areas that may have experienced drastic growth after the pandemic, and housing costs have structurally shifted upward as demand remains elevated. Most metros will fall somewhere between Level 3 and 4.
At this level, people start to factor in the cost of living, quality of life, and the feasibility of commutes. The big three, New York, Miami, and Los Angeles, are almost in a separate category. While they do offer some of the priciest luxury listings in the country, it’s not the entire market/metro area. We run into some of these markets later on. These also contain major cities that attract international attention, some second-home properties, and short-term visitors, all of which keep prices higher due to constant demand.
This level also includes pandemic-era boomtowns that have structurally repriced upward and show no signs of reverting. Boise, ID, is one of only two markets nationally to fully surpass its pandemic-era peak as of early 2026, with luxury prices 4.2% above that level. Seattle and Boston each retained roughly 80% to 89% of their pandemic-era gains, reflecting buyer pools and supply constraints deep enough to keep prices stable.
(Data Characteristics: Million-dollar-plus listings over the past 12 months are over 1,000, 90th percentile listing price above $1.5 million, or Markets that experienced drastic post-pandemic growth, over 200% growth in million-dollar listings and retained pandemic price run-ups)
Example Markets:
- New York-Newark-Jersey City, NY-NJ: Deepest luxury inventory in the country as of May 2026 with the entry point to luxury just over $2.9 million.
- Los Angeles-Long Beach, CA: With a million-dollar inventory at 9,300-plus, and an entry luxury threshold above $4.2 million. The $1M to $2M tier has a median square footage just over 1,980, reflecting land scarcity across the basin.
- Miami-Fort Lauderdale, FL: A structural shift in luxury inventory depth driven by international buyers and out-of-state migration. Miami’s flatter seasonal curve reflects a year-round luxury market.
- Seattle-Tacoma-Bellevue, WA: Retained 89% of its pandemic-era gains, with a luxury entry near $2.09 million and homes selling in a median of 31 days at that tier.
- Boise City, ID: One of only two metros nationally to fully surpass its pandemic peak, with luxury prices 4.2% above that level and a median year built of 2021 for luxury homes.
- Boston, MA; Washington, DC; San Francisco, CA; Bend, OR; and Bozeman, MT are also examples of markets that fit at this level. Showing where access, economic density, or pandemic-era structural repricing have pushed luxury well above the national benchmark.
| Area | Geo Type | Median Listing | Million Dollar Listing Share | Million Dollar Listing Count | Median SqFt $1 – $2 Million | 90th Percentile Listing Price | 95th Percentile Listing Price | 99th Percentile Listing Price |
| New York-Newark-Jersey City, NY | Metro | $775K | 34.4% | 12,771 | 1,950 | $2.90M | $4.86M | $14.78M |
| Los Angeles-Long Beach, CA | Metro | $1.10M | 53.6% | 9,928 | 1,966 | $4.19M | $7.22M | $21.92M |
| Miami-Fort Lauderdale, FL | Metro | $499K | 22.9% | 10,060 | 2,134 | $2.50M | $4.56M | $14.89M |
| Seattle-Tacoma-Bellevue, WA | Metro | $780K | 33.4% | 3,490 | 2,650 | $2.09M | $2.90M | $6.49M |
| Boise City, ID | Metro | $629K | 22.7% | 610 | 3,220 | $1.45M | $1.99M | $3.49M |
Level 5
Intentional Destinations

Greenwich, CT Leland Sandberg – Adobe Stock
Level 5 goes into markets where the draw is not necessarily built by hubs of commerce, but more around scenery. These are largely established markets, and real estate comes at a premium due to limited space and where high-net-worth individuals retreat from the Level 4 metros for weekends, vacations, and eventually permanent relocation. There are examples of higher prices in Level 4, but they often come with compromises, and prices are often a function of demand density and congestion, which can be bypassed here. This level also starts to taper down from larger metros to micropolitan areas and counties.
Westchester County, the premier commuter-luxury market in the Hudson Valley, has 521 active million-dollar listings. Million-dollar listings spend a median of 26 days on the market compared to 56 at the national level. Westchester’s most sought-after communities have little buildable land remaining, and high-end homeowners hold for long periods, meaning visible inventory at any given moment is a fraction of the total value locked in the county’s housing stock.
(Data Characteristics: 90th percentile listing price typically settles between $2.8 to $5 million, and the number of million-dollar properties is typically between 300 and 1,000)
Example Markets:
- Key West-Key Largo, FL: A micropolitan area with more million-dollar listings than most major metros, a luxury entry above $4.8 million. Development limits and a finite supply of buildable land keep supply structurally tight, allowing pricing to hold even as other high-cost destinations have recalibrated.
- Bridgeport-Stamford-Danbury, CT: The metro that includes Greenwich, one of the wealthiest communities in the country, with a luxury entry at $4.2 million. Greenwich has long served as the preferred retreat for Manhattan’s financial elite, offering estate-scale properties, low density, and direct rail access to the city.
- Sonoma County, CA: Half of all active listings are priced above $1 million, with a luxury entry at $3.5 million. Wine country access, proximity to the coast, and a lifestyle identity distinct from the broader Bay Area have sustained high-end demand even as neighboring markets have softened.
Level 6
Ultraluxury – Pure Luxury

Jackson, Wyoming George Rose – Getty Images
Level 6 gets into Pure Luxury territory. This is where the typical home is a luxury home. This can combine aspects from previous levels all into one. You can get space, access to world-class amenities, and stunning views. Ultraluxury markets are intentional, and typically have limits on how much can be built. This is typically because these locations are on islands, are geographically limited, such as mountain ranges, or are surrounded by protected areas with strict zoning laws. Tax implications start to become a mandatory consideration at this level. Estate planning and wealth protection are factors in many of these locations, beyond the renowned views and luxury estates.
Wyoming is one of nine states with no state income tax. Additionally, Wyoming’s Dynasty Trusts allow ultrawealthy families to pass down generational wealth while avoiding state income, estate, and inheritance taxes. That framework is a meaningful part of the Jackson Hole story. The median listing price of $1,746,750 places even a typical Jackson home above the national luxury threshold, while 68% of all listings are at or above $1 million.
(Data Characteristics: Typically fewer than 500 million-dollar listings and at least 50% of listings are in the million-dollar-plus range)
Example Markets:
- Hailey, ID: 62% of listings above $1 million, a 90th percentile at $8.93 million, and a 90-year resort legacy with constrained land supply. The 2020s have seen 15.6% of inventory from new construction, above the national share, reflecting renewed development in the valley’s southern communities where buildable land remains.
- Jackson, WY-ID: 68% of listings above $1 million, with a 99th percentile at $37.96 million and Wyoming’s tax structure drawing ultraluxury buyers alongside world-class Teton Range scenery and proximity to two national parks.
- Santa Barbara County, CA: 70% of listings above $1 million, a median above $1.8 million, and a 90th-percentile threshold of $8.99 million. Home to some of the most expensive ZIP codes in the country, including Montecito (93108) with a median listing price of $6.95 million.
- Napa County, CA: Over 64% of listings above $1 million, a luxury entry near $5.5 million, and a buyer profile defined by lifestyle and viticulture rather than proximity to a major employer.
- Vineyard Haven, MA (Martha’s Vineyard): 91% of listings above $1 million, a median of $2.5 million, and a market defined by island scarcity and generational buyer loyalty.
- Kapaa, HI (Kauai): 66% of listings above $1 million, a median of $1.4 million, and a luxury entry at $6.09 million, driven by island geography and the irreplaceable appeal of Kauai’s north shore.
| Area | Geo Type | Median Listing | Million Dollar Listing Share | Million Dollar Listing Count | Median SqFt | 90th Percentile Listing Price | 95th Percentile Listing Price | 99th Percentile Listing Price |
| Hailey, ID | Micro | $1.25M | 53.1% | 104 | 2,154 | $8.93M | $13.61M | $22.03M |
| Jackson, WY-ID | Micro | $1.72M | 66.1% | 240 | 2,246 | $7.32M | $13.14M | $37.96M |
| Santa Barbara County, CA | County | $1.80M | 70.2% | 432 | 2,118 | $9.00M | $15.45M | $38.07M |
| Napa County, CA | County | $1.40M | 63.7% | 338 | 2,100 | $5.5M | $8.18M | $18.5M |
| Vineyard Haven, MA | Micro | $2.50M | 90.9% | 170 | 2,348 | $7.95M | $12.71M | $21.75M |
| Kapaa, HI | Micro | $1.40M | 66.4% | 245 | 1,443 | $6.09M | $8.55M | $19.89M |
| Heber, UT* | Micro | $1.45M | 63.5% | 813 | 2,819 | $6.25M | $8.70M | $21.22M |
(Heber has over 500 million-dollar listings, but has the same characteristics of a Pure Luxury Market)
Level 7
Elite Ultraluxury – Beyond the Data

Aspen, CO – Getty Images
These markets are in a league of their own. They are not only among the most expensive homes in the country but also among the most expensive in the world. When these homes are for sale, there are likely only a few thousand potential buyers in the world that could make the purchase.
These are more than homes, they are statements, and valuation goes into the story being told. Each of these is truly one-of-a-kind and is typically found in clusters of ZIPs, not entire metros or cities. Some of these locations will be found within the metros that cover previous levels, but their distinct locations are truly in a league of their own.
Fisher Island is located within the Miami metropolitan area, however, its level of luxury is on a separate level compared to anything else in the local market.
(Data Characteristics: These are some of the most expensive ZIP codes and areas within the country; they usually operate beyond the data and have few to no comps to gauge them.)
Example Markets:
- Fisher Island, FL (33109): Accessible only by ferry, private boat, or helicopter, with a median listing price of $10.98 million and 100% of listings priced above $1 million.
- Newport Coast, CA (92657): The most expensive ZIP in the country as of January 2026, with a median of $12.50 million and homes averaging over 5,100 square feet.
- Bridgehampton, NY (11932): A Hamptons anchor with a median of $10.49 million and 100% of listings above $1 million.
- Bel Air, CA (90077): A median of $7.43 million with 90th-percentile listings starting at $39.99 million.
- Beverly Hills, CA (90210): A median of $9.38 million across 237 active listings, making it one of the few ZIP-level markets with genuine depth at this price tier.
- Water Mill, NY (11976): A median of $7.85 million with the largest median SqFt of any ZIP on this list at 6,384 square feet.
- Atherton, CA (94027): The highest median listing price of any ZIP in the table at $14.80 million, with 100% of listings above $1 million.
- Aspen, CO (81611): A 90th-percentile entry point of $24.95 million and a 99th percentile of $74.45 million, among the highest ultraluxury ceilings in the country.
- Upper West Side, NY (10023): A Manhattan ZIP with a 90th percentile of $9.72 million and a 99th percentile of $48.06 million.
- Midtown West, NY (10019): Anchored by Central Park South and Columbus Circle, with a 90th percentile of $11.40 million and a 99th percentile of $46.50 million across 420 active listings.
| Area | Geo Type | Median Listing | Million Dollar Listing Share | Million Dollar Listing Count | Median SqFt | 90th Percentile Listing Price | 95th Percentile Listing Price | 99th Percentile Listing Price |
| Aspen, CO (81611) | ZIP | $2.72M | 60.1% | 125 | 1,805 | $24.95M | $34.98M | $74.45M |
| Newport Coast, CA (92657) | ZIP | $12.50M | 100.0% | 45 | 5,145 | $46.50M | $63.59M | $66.53M |
| Fisher Island, FL (33109) | ZIP | $10.98M | 100.0% | 44 | 3,600 | $35.60M | $44.10M | $53.32M |
| Beverly Hills, CA (90210) | ZIP | $9.38M | 99.2% | 237 | 5,390 | $29.75M | $38.70M | $78.28M |
| Bridgehampton, NY (11932) | ZIP | $10.49M | 100.0% | 36 | 5,578 | $25.00M | $33.38M | $60.60M |
| Bel Air, CA (90077) | ZIP | $7.43M | 92.4% | 109 | 5,210 | $39.99M | $55.00M | $128.10M |
| Water Mill, NY (11976) | ZIP | $7.85M | 98.7% | 74 | 6,384 | $28.75M | $33.05M | $66.09M |
| Atherton, CA (94027) | ZIP | $14.80M | 100.0% | 13 | 6,914 | $32.35M | $40.10M | $47.76M |
| Upper West Side, NY (10023) | ZIP | $1.70 | 66% | 128 | 1,291 | $9.72M | $15.99M | $48.06M |
| Midtown, NY (10019) | ZIP | $1.65 | 70% | 96 | 1,200 | $11.40M | $19.40M | $46.50M |
Luxury comes in different forms for buyers who value different aspects, whether that’s space, proximity to a major city, coastal access, or tax benefits. There is no right answer, and no losers in the 7 levels of luxury. Each offers a strong selling point to draw in the right buyers.
These levels also shift over time. Markets that looked like Level 1 a decade ago now sit firmly at Level 4 after rapid growth and expansion. Some of today’s emerging markets will be established metros in another five years.
All data in this report is sourced from Realtor.com® listing trends as of May 2026, reflecting active inventory of existing homes, including single-family residences, condos, townhomes, row homes, and co-ops. Listings reflect only those provided by MLS platforms to Realtor.com via a listing feed. New-construction listings are excluded unless actively listed on participating MLSs.
Luxury segmentation is based on market-specific price percentiles, with the 90th percentile representing entry-level luxury, the 95th percentile marking high-end luxury, and the 99th percentile indicating ultraluxury. All calculations are based on listing prices, not final sales prices.
Metropolitan and micropolitan areas are defined using the Office of Management and Budget’s OMB-2023 delineations, with Claritas 2025 household estimates used for relative comparisons. Where appropriate, we limited analysis to metros or micros with a minimum threshold of active million-dollar listings on average over the past year to ensure meaningful comparisons.
Historical listing trend data extends to July 2016, but year-over-year comparisons in this report use May 2025 as the baseline.
Luxury by the Numbers
90th percentile = Entry-level luxury (top 10% of prices)
95th percentile = High-end luxury
99th percentile = Ultraluxury (often rare or custom properties)
Disclaimer: The information provided on this website is for educational and informational purposes only and should not be considered financial, investment, or legal advice. Stock markets, real estate, and other financial instruments involve significant risks, and past performance does not guarantee future results. You should conduct your own research and/or seek advice from a licensed financial advisor before making any investment decisions. The website owner is not liable for any financial losses or damages arising from the use of the information presented here.


