Highlights
- National luxury prices reached $1,283,432 in May, though year-over-year declines continue for the 26th consecutive month at -1.4%. The pace of annual softening has pulled back considerably from the 5%-plus drops seen in early 2025, suggesting the national luxury floor may be taking shape.
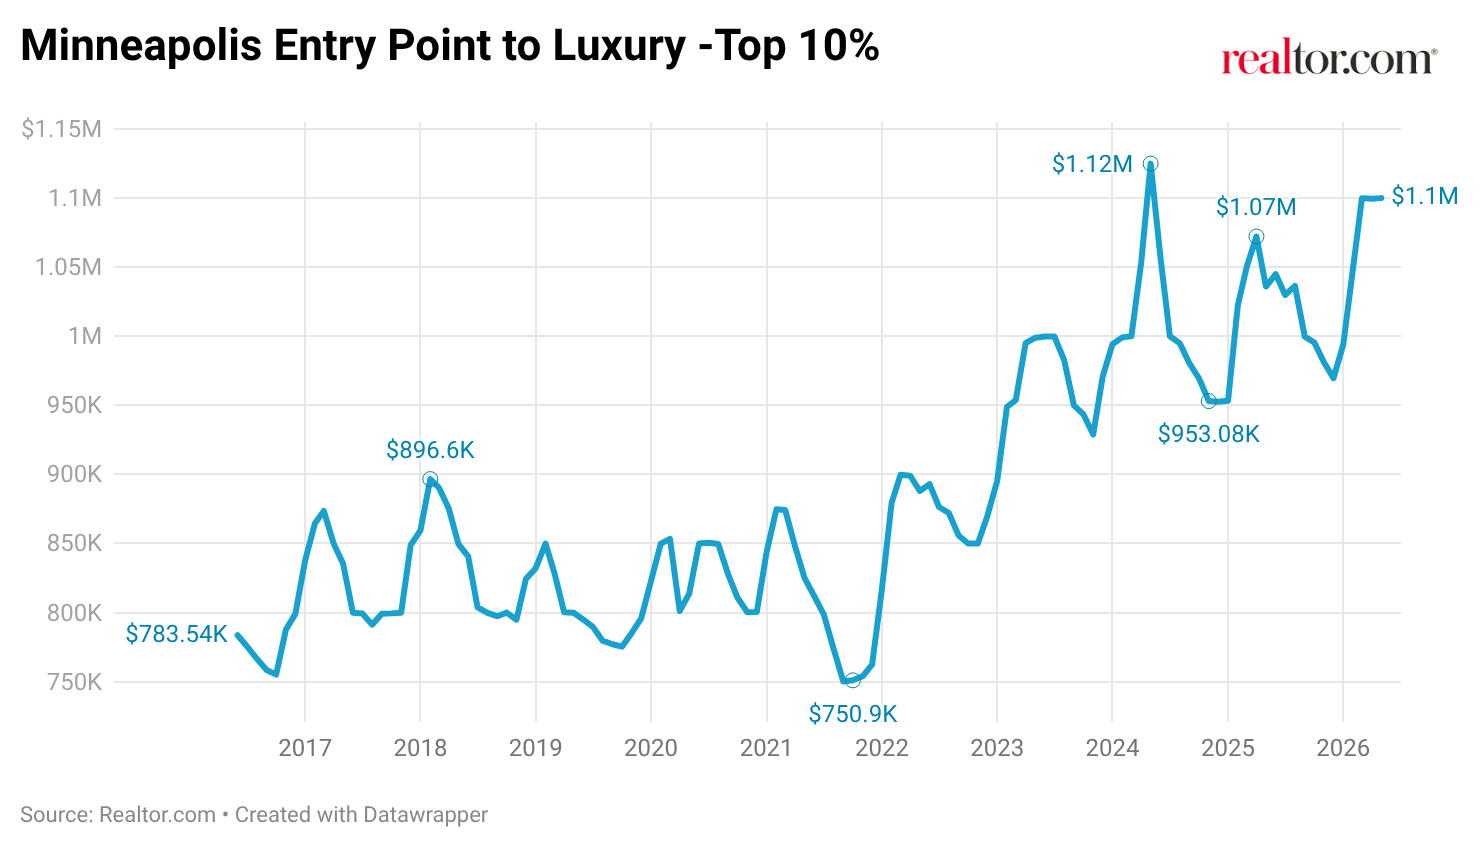
- Among tracked luxury metros, only Minneapolis (5.0%) and Boise City (4.2%) have fully surpassed their pandemic-era peaks as of February 2026. Nationally, the luxury market is down 13.7% from the pandemic peak (February 2020 to February 2026), with outcomes ranging widely across markets.
- San Francisco’s luxury tier sits $695,000 below its February 2020 baseline as of February 2026, the most extreme reversal of any market tracked. However, AI equity liquidity events are introducing a counterforce.
- Five markets have fallen entirely below their pre-pandemic baselines: San Francisco (-142.0%), San Jose (-54.4%), Denver (-13.7%), Kahului-Wailuku (-6.3%), and Urban Honolulu (-3.0%).
National Luxury Overview
| Pricing | May 2026 | Monthly Change | YoY Change |
| Luxury Threshold 90th Percentile | $1,283,432 | 0.7% | -1.4% |
| High-End Luxury Threshold 95th Percentile | $2,000,466 | -0.1% | -5.5% |
| Ultraluxury Threshold 99th Percentile | $5,566,377 | -2.5% | -4.4% |
| Million-Dollar Listing Share | 13.80% | 0.3pp | -0.6pp |
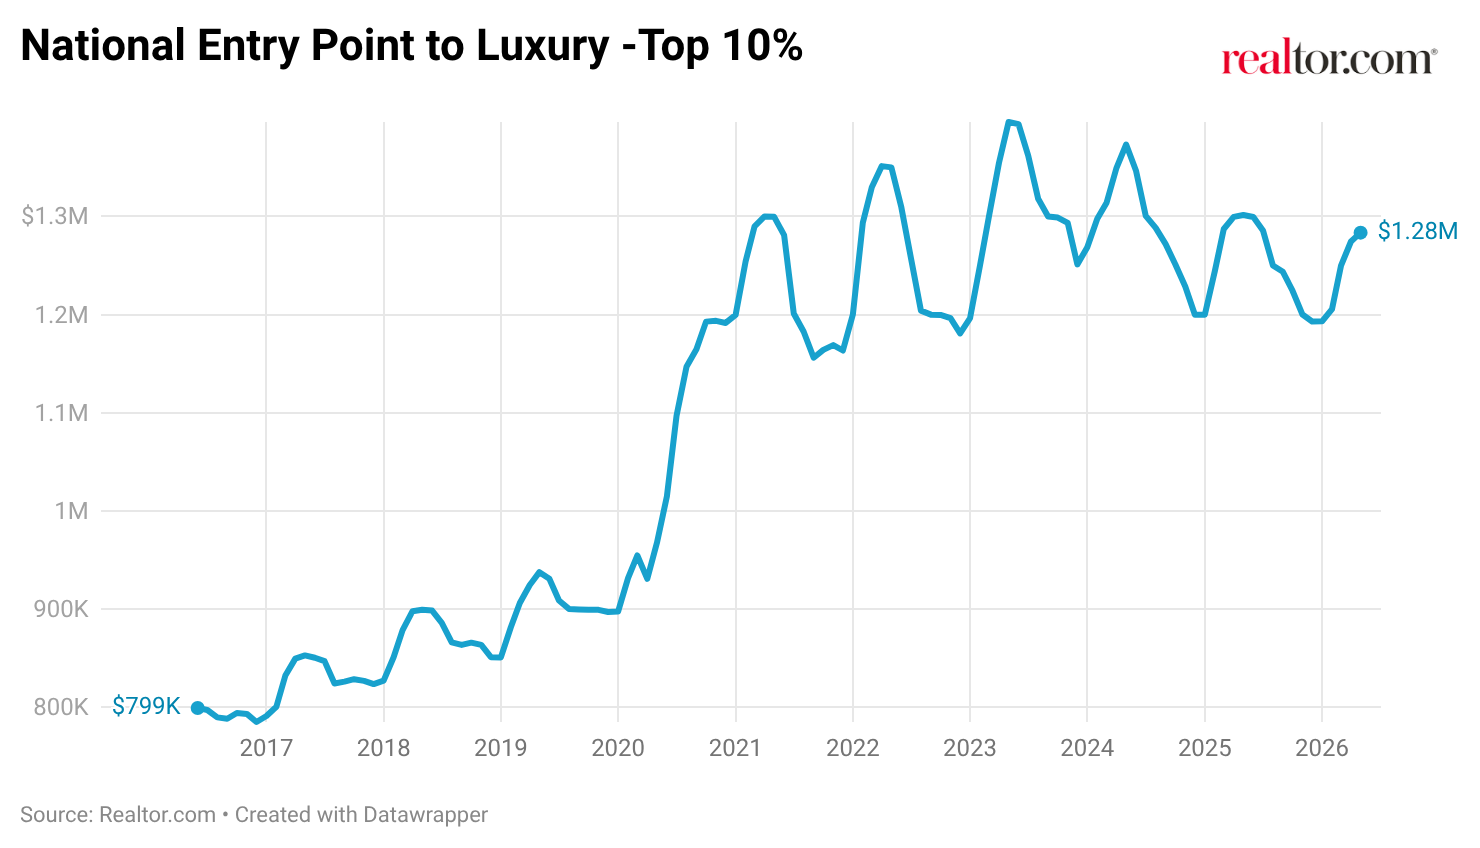
The national entry point to luxury reached $1,283,432 in May; however, this is the 26th consecutive month the figure has come in below year-ago levels, down 1.4% from May 2025. Despite the ongoing annual drops over the last 2 years, the pace of decline has eased. At the peak of the recalibration in early 2025, the 90th-percentile threshold was declining just over 5% year-over-year. The national luxury threshold remains 8.1% below its May 2023 peak of roughly $1.40 million.
The tiered picture was consistent, with entry luxury (-1.4%), high-end (-5.5%), and ultraluxury (-4.4%) all coming below the year-ago level. The million-dollar listing share rose to 13.8% in May, up 0.3 percentage points from April and 0.6 percentage points below a year ago, reflecting a market where high-end supply is gradually rebuilding but remains below recent peaks and above pre-pandemic norms.
Pace of the Luxury Market
| Indicator | May 2026 | Monthly (Days) | YoY (Days) |
| Median Days on Market 90th Percentile | 58 | 1 day faster | 1 day faster |
| Median Days on Market 95th Percentile | 66 | 1 day faster | 1 day faster |
| Median Days on Market 99th Percentile | 86 | 0 days faster | 0 days slower |
| Median Days on Market Median Listing | 52 | 0 days faster | 1 day slower |
Top 10 Most Expensive Metropolitan Luxury Markets
| Rank | Area | 10% Most Expensive Listings Start at: | 10% Most Expensive MoM | 10% Most Expensive YoY | Average Annual Million-Dollar Listings Count | Multiple to National Luxury Median |
| 1 | Bridgeport-Stamford-Danbury, CT | $4,199,000 | -3.2% | -11.0% | 529 | 3.3 |
| 2 | Los Angeles-Long Beach-Anaheim, CA | $4,193,063 | -0.1% | -6.5% | 9,304 | 3.3 |
| 3 | Kahului-Wailuku, HI | $3,950,000 | -1.2% | -1.1% | 712 | 3.1 |
| 4 | Naples-Marco Island, FL | $3,746,344 | 1.5% | 4.3% | 2,238 | 2.9 |
| 5 | Santa Rosa-Petaluma, CA | $3,492,000 | 5.3% | -0.2% | 503 | 2.7 |
| 6 | San Jose-Sunnyvale-Santa Clara, CA | $3,488,375 | -0.3% | -6.8% | 1,070 | 2.7 |
| 7 | Oxnard-Thousand Oaks-Ventura, CA | $3,125,000 | -7.7% | -0.2% | 652 | 2.4 |
| 8 | Crestview-Fort Walton Beach-Destin, FL | $2,992,000 | -0.1% | 3.2% | 1,397 | 2.3 |
| 9 | New York-Newark-Jersey City, NY-NJ | $2,902,358 | -2.4% | -6.6% | 11,495 | 2.3 |
| 10 | San Diego-Chula Vista-Carlsbad, CA | $2,849,097 | -0.1% | -4.9% | 2,328 | 2.2 |
(Among metropolitan areas that averaged at least 500 million-dollar listings over the 12 months through May 2025)
The composition of the top 10 was unchanged from April, with the same 10 markets appearing in slightly different order. Santa Rosa-Petaluma, CA, moved up two positions to fifth after a 5.3% monthly gain, pushing San Jose-Sunnyvale-Santa Clara, CA, down to sixth. Oxnard-Thousand Oaks-Ventura, CA, posted the largest monthly drop on the list at -7.7%, sliding from sixth to seventh.
Year-over-year, Naples-Marco Island, FL (+4.3%) and Crestview-Fort Walton Beach-Destin, FL (+3.2%) were the only markets on the list with positive annual price growth. Kahului-Wailuku, HI, and Santa Rosa-Petaluma, CA, both came within 2 percentage points of being flat year-over-year, while Bridgeport-Stamford-Danbury, CT, posted the steepest annual decline at -11.0%, continuing the recalibration in Connecticut commuter markets that has played out over the past 18 months.
The New York metro has the largest inventory of million-dollar listings, averaging 11,495 over the past year, nearly matching its spring inventory builds in prior years. Its luxury threshold of $2,902,358 is down 6.6% year over year.
Post-Pandemic Gains
The COVID-19 pandemic altered the world, shifting everything from large-scale industry trends to daily activities. One of the areas that changed most was real estate. At the onset of the pandemic, many Americans were in quarantine conditions; life as we knew it paused, and we entered an era of unknowns. Homes that were once pit stops in the rush of daily life became everything at once: offices, schools, gyms, sanctuaries, and more. That transformation changed how Americans thought about the functions of home, and this was one of several factors that drove major shifts in the pandemic-era housing market.
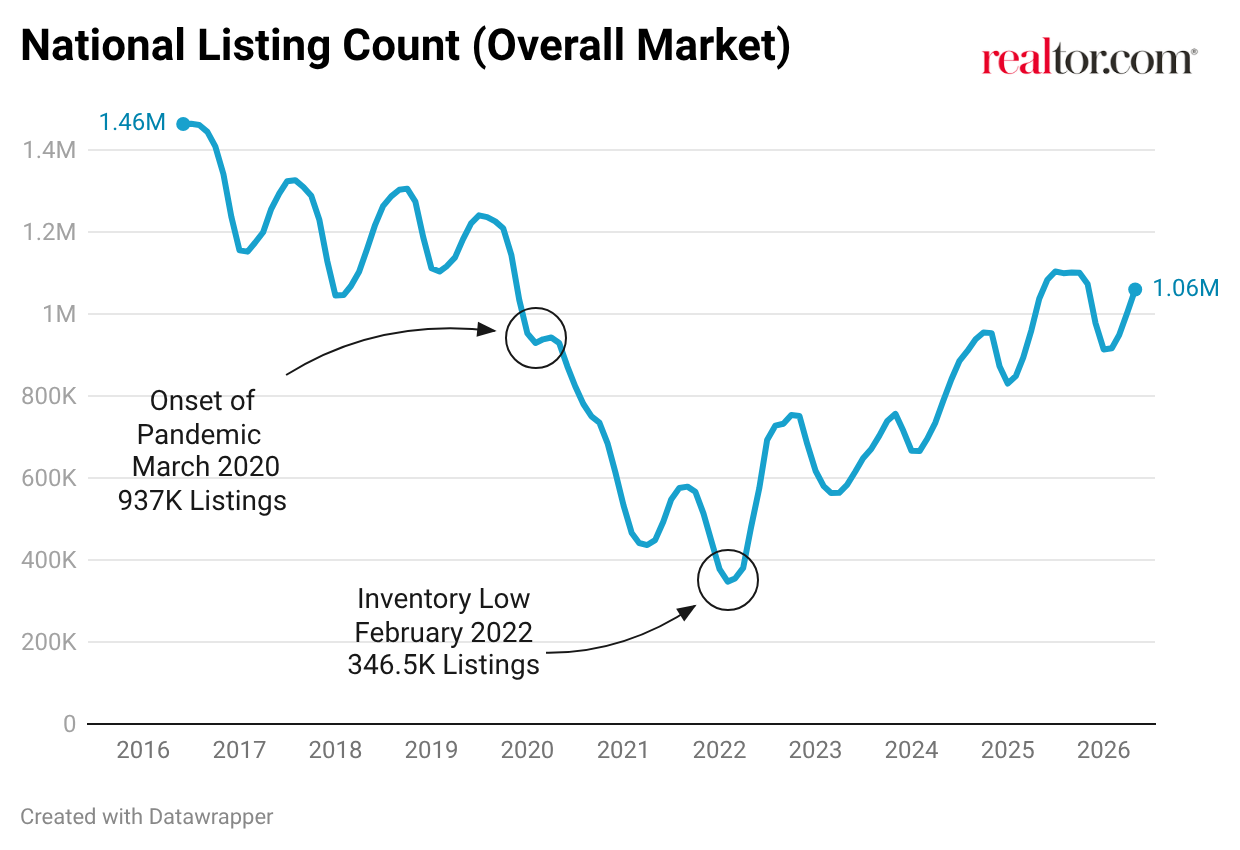
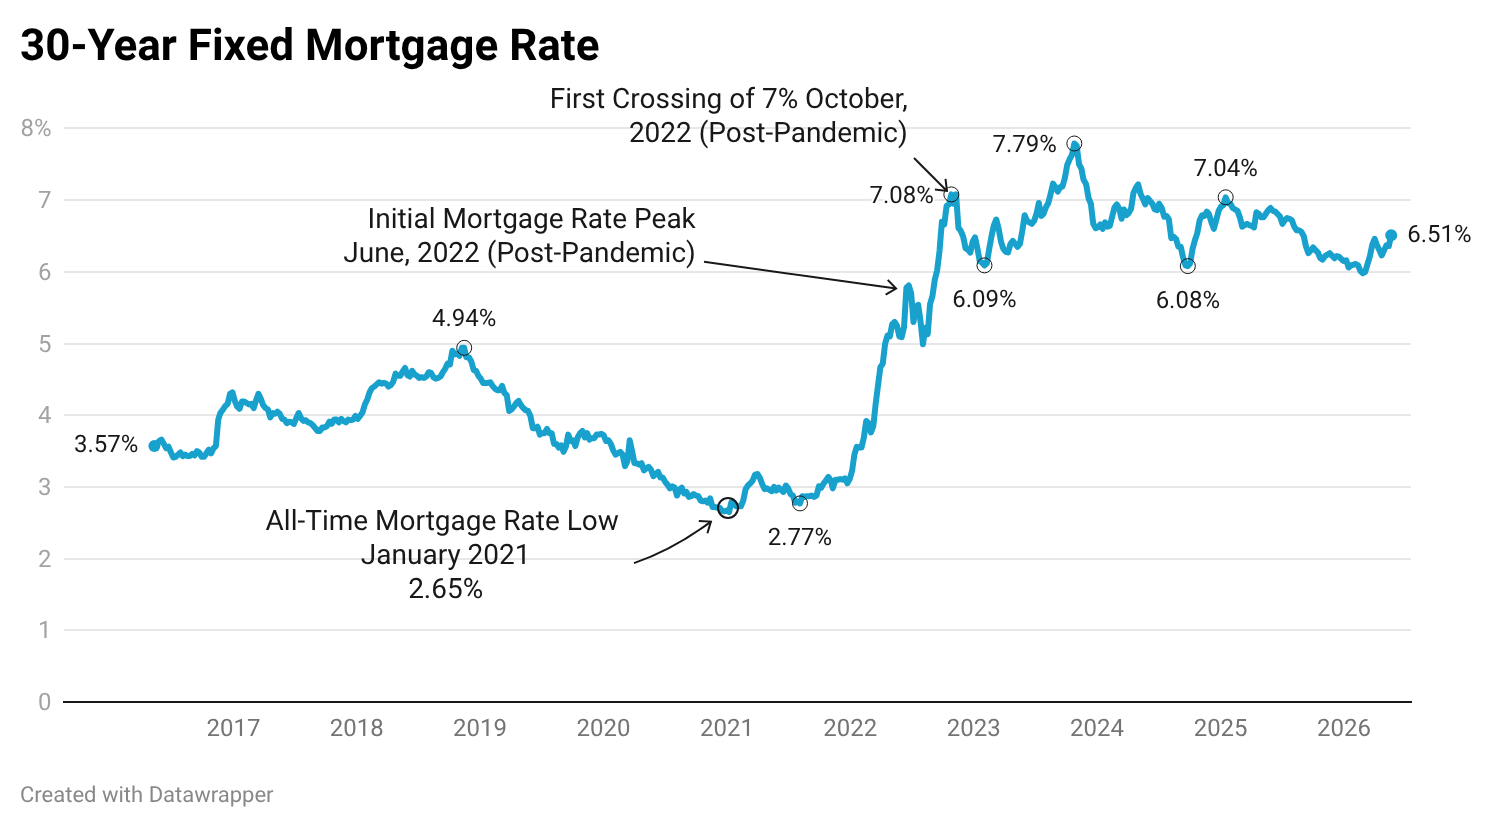
The initial impact on the housing market was shock, but this was short-lived. In the spring of 2020, sellers pulled homes off of the market, buyers stepped back, and a frozen market replaced what had been a functioning real estate economy. By summer 2020, however, a rapid thaw was underway; buyers were back with urgency, untethered from their offices by remote work and drawn by mortgage rates that would eventually fall to 2.65%, an all-time low reached in January 2021.
Combined with a sharp drop in available inventory, that environment produced a two-year run of price appreciation that compressed growth that might otherwise have taken a decade into 24 months. The national median listing price surged. Time on market collapsed. Sellers received multiple offers above asking price within days of listing. For many buyers, especially those priced out of expensive coastal cities, the pandemic reshuffled where they could afford to live, fueling demand in suburbs, resort towns, and mid-sized metros that had been quiet for years.
At the luxury tiers, the dynamics were both similar and distinct. Some of the factors that drove luxury demand during the pandemic included the premium placed on space and privacy, wealth effects from equity markets that held up better than many expected, and a significant reshuffling of where affluent households wanted to live. Markets that offered outdoor recreation, low density, and a lifestyle accommodating remote work surged. The gains came quickly and, in some cases, reached levels that could not be sustained once the broader macroeconomic environment shifted.
The Fed began raising rates in March 2022. By late October 2022, the 30-year fixed had passed 7% for the first time since April 2002. The rate shock did not affect luxury equally. A significant factor came from remote work. During this period, those with remote or hybrid work arrangements utilized that flexibility to expand their home searches to out-of-market properties, avoiding the constraints of expensive urban job centers. Overall, buyers in areas with flexible work modes look locally only 21.4% of the time, compared to 26.4% for those in less flexible areas.

Before the pandemic, the national share of million-dollar listings operated within a band from low 7% to just over 9% at the pandemic’s onset in March 2020. As price appreciation compressed the line between mid-market and luxury, that share surged to a peak of 15.4% in May 2023 and, at 13.8% in May 2026, remains well above any pre-pandemic reading. The absolute count of million-dollar listings is just over 146,000, about 40% above the pre-pandemic peak, even as the total number of home listings remains 100,000 lower than pre-pandemic highs.
The table below ranks the markets tracked in this analysis by the share of their pandemic-era price run-up that remains intact as of February 2026. The comparison uses February 2020 as the pre-pandemic baseline and February 2026 as the current reference point, a like-for-like seasonal match that avoids the distortions introduced by comparing winter prices to spring prices. The pandemic peak is defined as the highest 90th-percentile listing price recorded between June 2020 and December 2023. Markets above 100% have surpassed their pandemic peaks; markets below 0% have fallen beneath their pre-pandemic baseline.
Markets Retaining the Most Pandemic-Era Luxury Gains
| Rank | Market | Feb 2020 Baseline | Pandemic Peak | Peak Month | Feb 2026 Price | May 2026 Price | % Run-Up Retained |
| — | USA (National Benchmark) | $931K | $1.40M | May 2023 | $1.21M | $1.28M | 59.0% |
| 1 | Minneapolis-St. Paul-Bloomington, MN-WI | $850K | $999K | Jul 2023 | $1.05M | $1.10M | 133.2% |
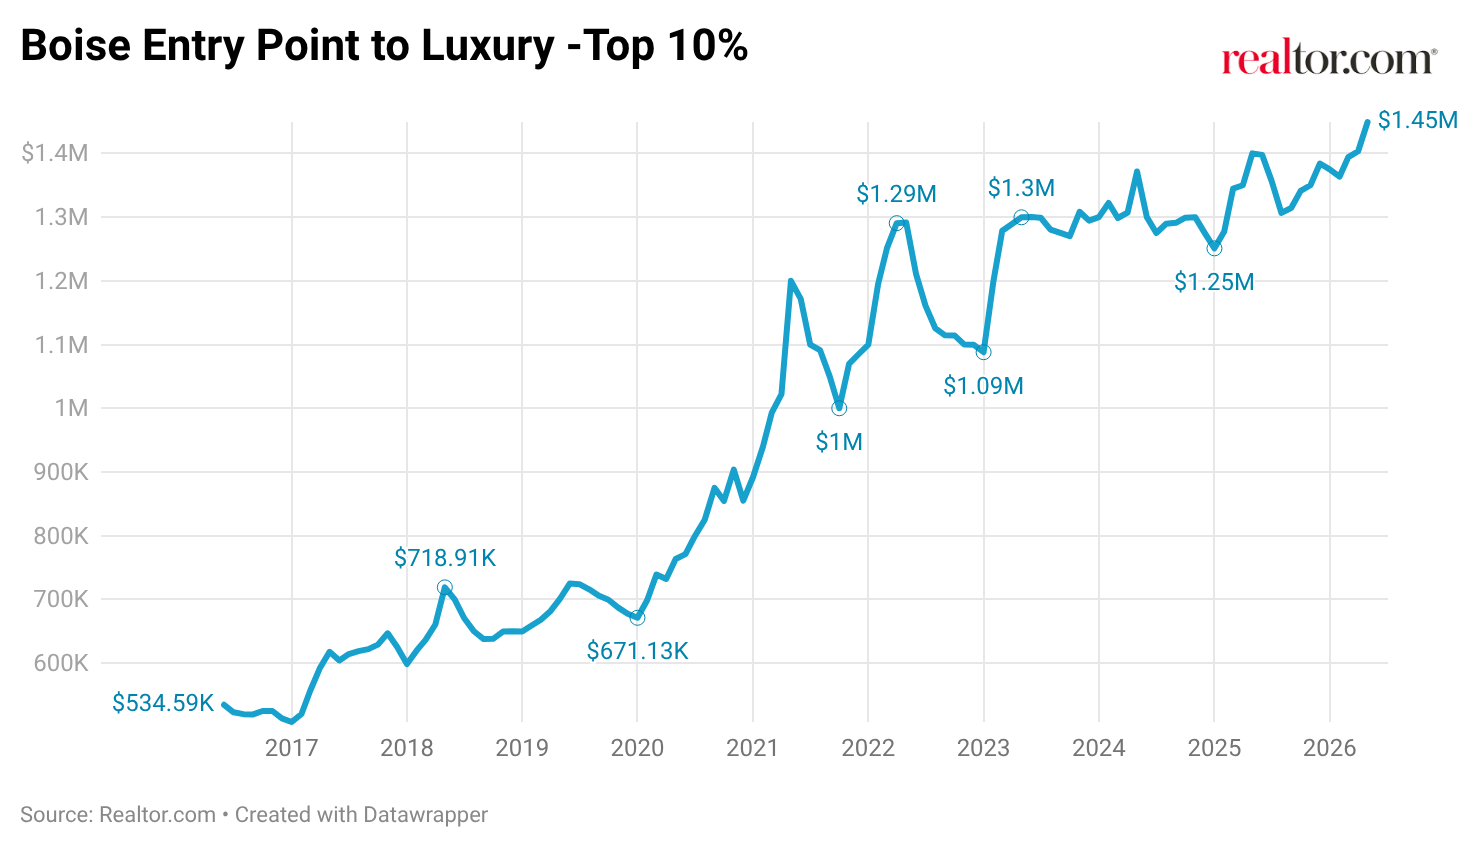
| 2 | Boise City, ID | $699K | $1.31M | Nov 2023 | $1.36M | $1.45M | 109.0% |
| 3 | Boston-Cambridge-Newton, MA-NH | $1.85M | $2.91M | May 2023 | $2.79M | $2.74M | 89.0% |
| 4 | Bend, OR | $1.13M | $1.90M | May 2023 | $1.81M | $1.80M | 88.8% |
| 5 | Riverside-San Bernardino-Ontario, CA | $984K | $1.38M | May 2023 | $1.32M | $1.30M | 84.8% |
| 6 | Raleigh-Cary, NC | $748K | $1.12M | Mar 2022 | $1.05M | $1.12M | 82.8% |
| 7 | Las Vegas-Henderson-North Las Vegas, NV | $799K | $1.28M | Apr 2022 | $1.20M | $1.20M | 81.6% |
| 8 | Wilmington, NC | $819K | $1.30M | Mar 2022 | $1.20M | $1.25M | 79.3% |
| 9 | New York-Newark-Jersey City, NY-NJ | $2.22M | $3.38M | Dec 2023 | $3.11M | $2.90M | 76.8% |
| 10 | Atlantic City-Hammonton, NJ | $1.30M | $2.80M | Jul 2023 | $2.40M | $2.50M | 73.4% |
| 11 | Tampa-St. Petersburg-Clearwater, FL | $750K | $1.30M | Jun 2023 | $1.15M | $1.15M | 72.8% |
| 12 | Atlanta-Sandy Springs-Roswell, GA | $750K | $1.00M | Jun 2023 | $926K | $994K | 70.1% |
| 13 | Portland-Vancouver-Hillsboro, OR-WA | $990K | $1.39M | Aug 2023 | $1.27M | $1.30M | 69.0% |
| 14 | Nashville-Davidson-Murfreesboro-Franklin, TN | $899K | $1.80M | Apr 2022 | $1.50M | $1.65M | 66.7% |
| 15 | Bridgeport-Stamford-Danbury, CT | $2.95M | $4.97M | May 2023 | $4.26M | $4.20M | 64.7% |
The Minneapolis and Boise metros are the only two markets to have fully surpassed their pandemic-era highs as of February 2026. Minneapolis didn’t have a significant pandemic price surge like many other metros, and it had a modest 17.6% run-up that peaked in July 2023. Continued appreciation has since pushed its luxury threshold 5.0% above that post-pandemic peak. The Minneapolis metro reached a high for the 90th percentile in May 2024, outside the timeframe measured for pandemic-related growth (June 2020 – December 2023), coming in at roughly $1.12 million, just above the current $1.10 million 90th percentile threshold in May 2026.
Boise City, where luxury prices rose 87.2% during the pandemic, hit a study-period peak in November 2023 and sits 4.2% above that level in February 2026. The Boise metro wasn’t the only Idaho market to experience significant growth from the pandemic. Hailey, Idaho, is a micropolitan just over 2 hours outside the Boise metro and had roughly $4 million in price growth since February 2020, ranking in the top 10% of the region and highlighting strong price growth after the pandemic.
Boston-Cambridge-Newton, MA-NH (89.0%), and Bend, OR (88.8%), lead among markets still below their peaks. Boston’s structural supply constraints and a persistent high-income buyer base tied to financial services and life sciences have sustained pricing through the rate cycle. This is a similar trend seen in various New England metros. Raleigh, Las Vegas, and Wilmington, NC, each retained more than 79% of their run-ups, all markets where structural demand has continued to absorb a modest supply recovery.
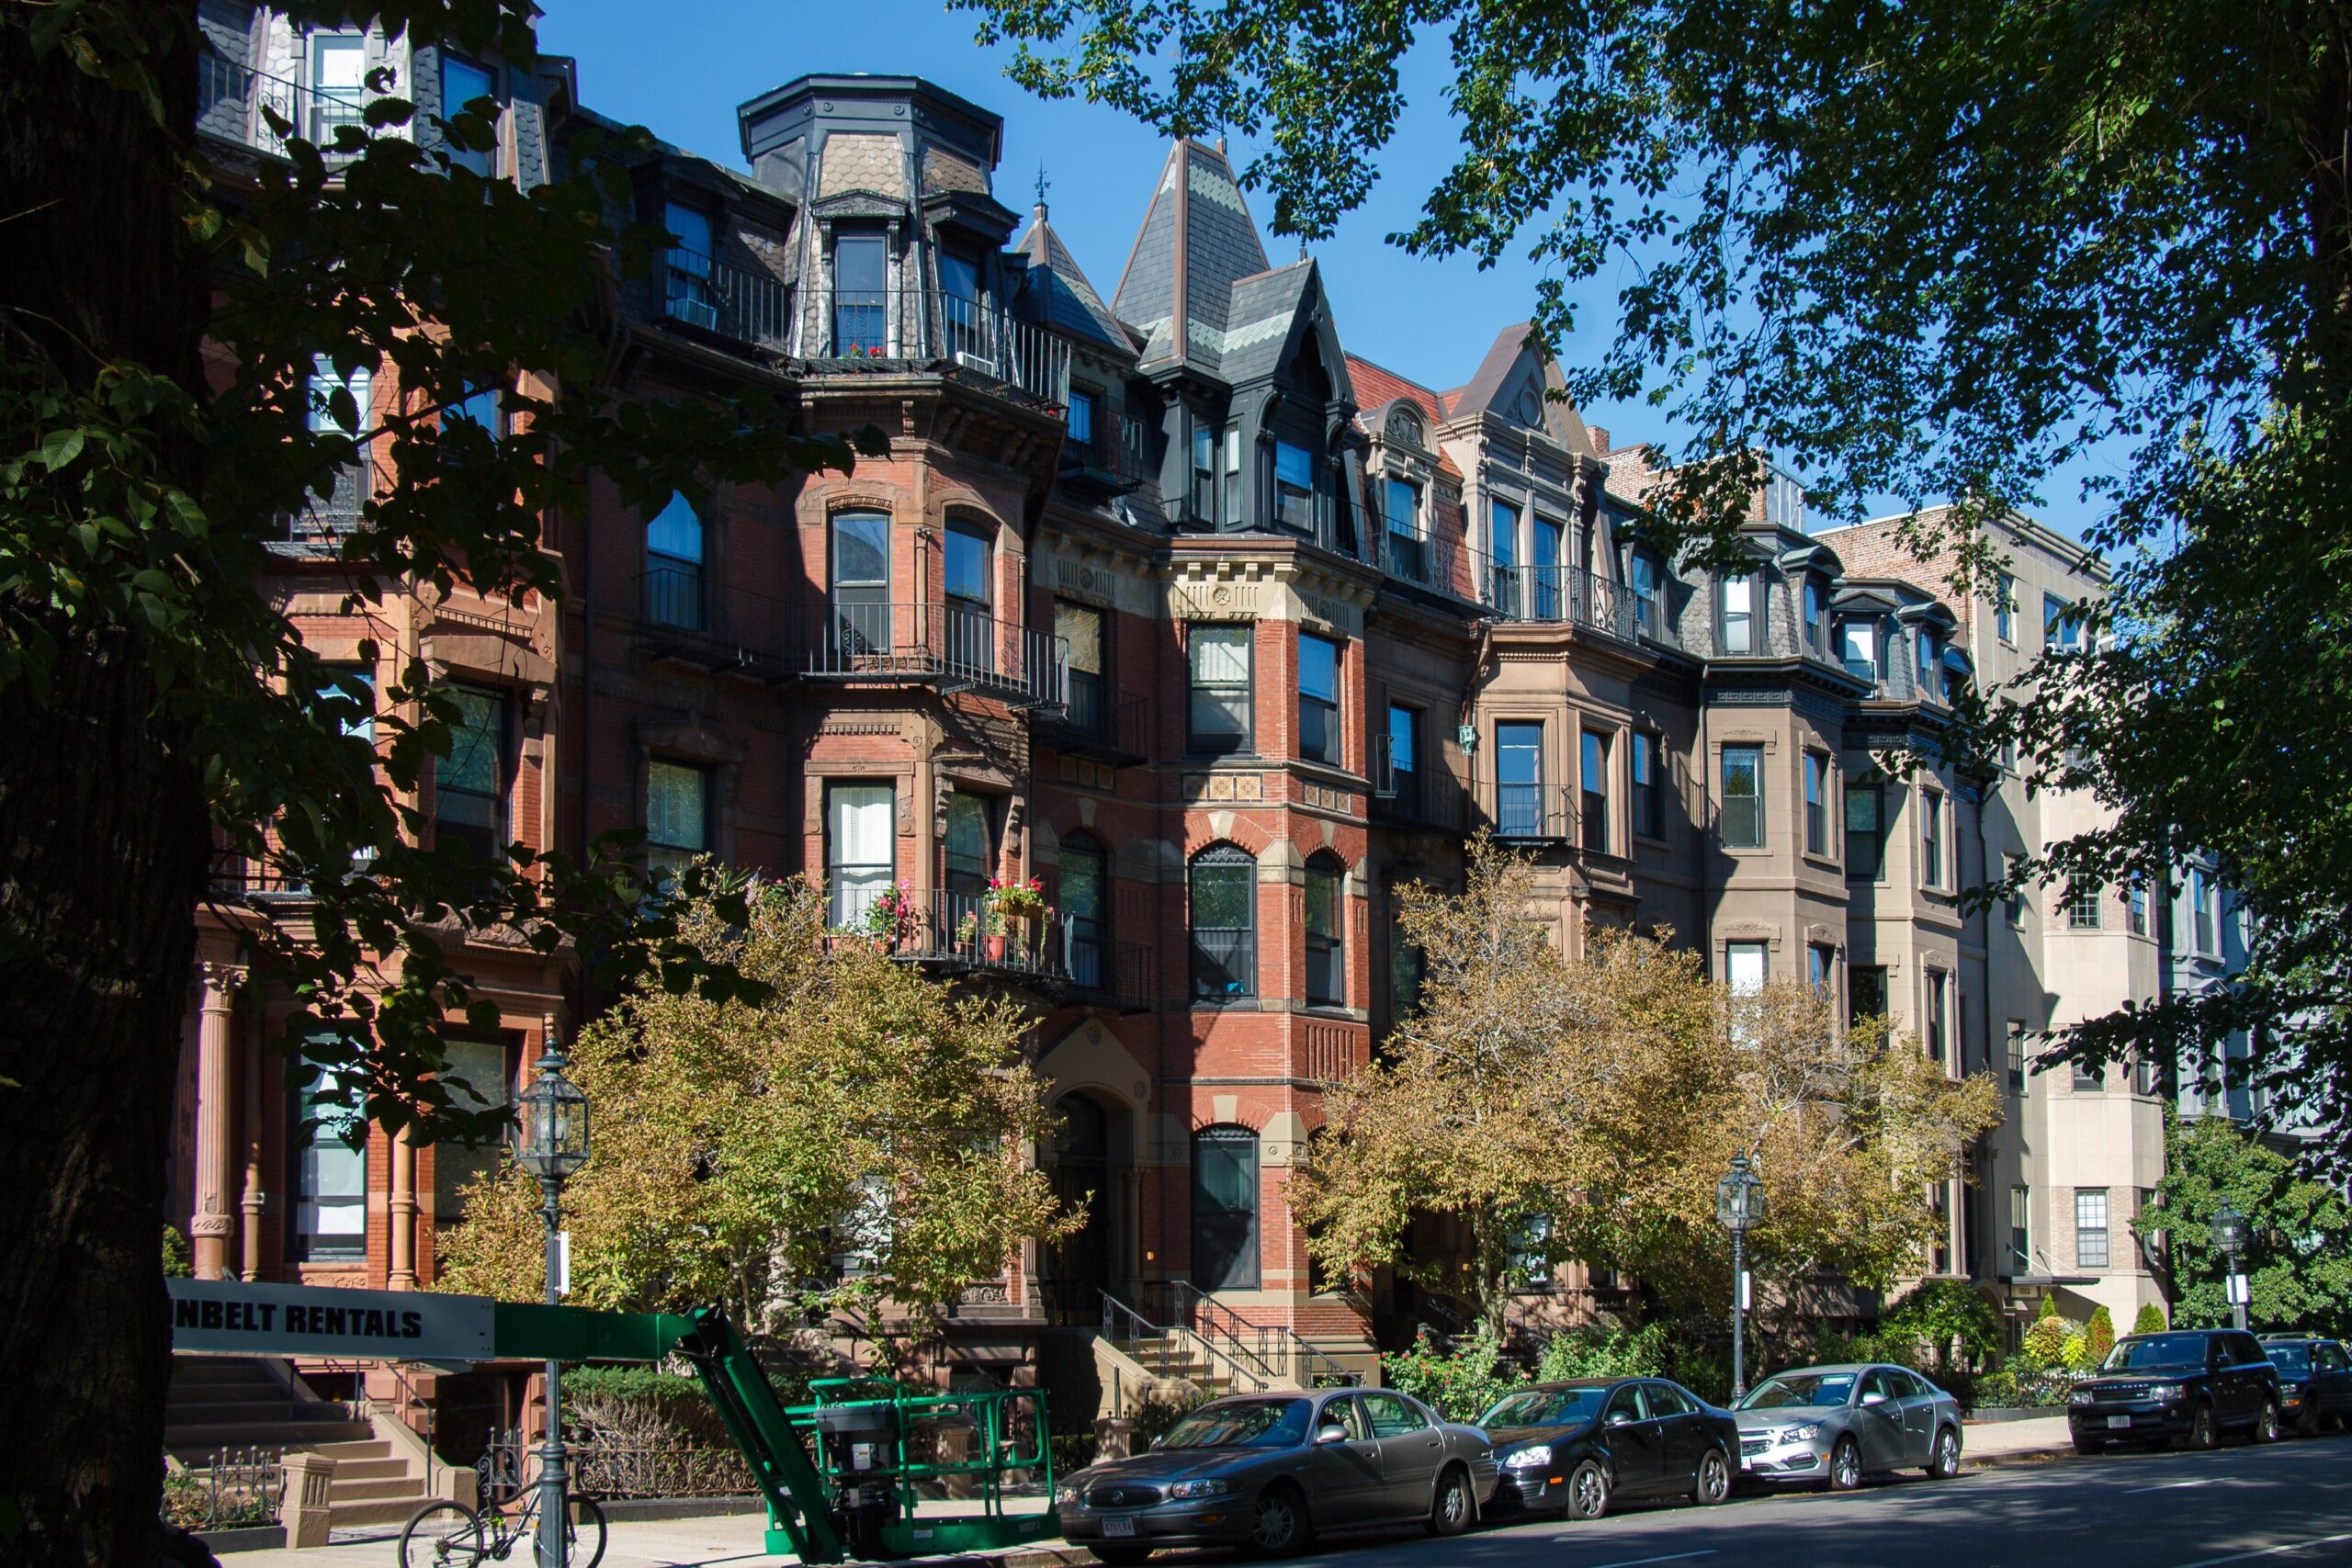
Back Bay Boston – Getty Images
New York-Newark-Jersey City, NY-NJ, retained 76.8% of its pandemic run-up, a stronger result than most coastal peers, and one aided by a December 2023 peak, the latest in the analysis. Nashville-Davidson-Murfreesboro-Franklin, TN, retained 66.7% despite a 100% run-up, while Bridgeport-Stamford-Danbury, CT, retained 64.7% of a 68.6% run-up.
Markets That Have Given Back the Most
| Rank | Market | Feb 2020 Baseline | Pandemic Peak | Peak Month | Feb 2026 Price | May 2026 Price | % Run-Up Retained |
| — | USA (National Benchmark) | $931K | $1.40M | May 2023 | $1.21M | $1.28M | 59.0% |
| 1 | San Francisco-Oakland-Fremont, CA | $3.19M | $3.68M | May 2023 | $2.50M | $2.69M | -142.0% |
| 2 | San Jose-Sunnyvale-Santa Clara, CA | $3.74M | $4.19M | Apr 2023 | $3.50M | $3.49M | -54.4% |
| 3 | Denver-Aurora-Centennial, CO | $1.40M | $1.85M | Jan 2022 | $1.33M | $1.35M | -13.7% |
| 4 | Kahului-Wailuku, HI | $4.39M | $7.01M | Aug 2023 | $4.23M | $3.95M | -6.3% |
| 5 | Urban Honolulu, HI | $2.32M | $3.32M | Aug 2021 | $2.29M | $2.11M | -3.0% |
| 6 | Washington-Arlington-Alexandria, DC-VA-MD-WV | $1.44M | $1.80M | Jun 2023 | $1.45M | $1.50M | 3.2% |
| 7 | Chicago-Naperville-Elgin, IL-IN | $893K | $1.20M | May 2023 | $911K | $990K | 5.9% |
| 8 | San Diego-Chula Vista-Carlsbad, CA | $2.70M | $3.90M | Jul 2023 | $2.85M | $2.85M | 13.3% |
| 9 | Oxnard-Thousand Oaks-Ventura, CA | $2.80M | $4.25M | May 2023 | $3.00M | $3.13M | 13.9% |
| 10 | Houston-Pasadena-The Woodlands, TX | $750K | $974K | May 2021 | $794K | $827K | 19.7% |
| 11 | Charlotte-Concord-Gastonia, NC-SC | $823K | $1.17M | Jun 2023 | $898K | $1.07M | 22.0% |
| 12 | Phoenix-Mesa-Chandler, AZ | $1.42M | $1.73M | Feb 2021 | $1.50M | $1.45M | 25.4% |
| 13 | Los Angeles-Long Beach-Anaheim, CA | $3.90M | $5.00M | May 2023 | $4.21M | $4.19M | 28.1% |
| 14 | Seattle-Tacoma-Bellevue, WA | $1.63M | $2.34M | Apr 2023 | $1.84M | $2.09M | 29.0% |
| 15 | Jacksonville, FL | $797K | $1.12M | Apr 2022 | $924K | $993K | 39.1% |
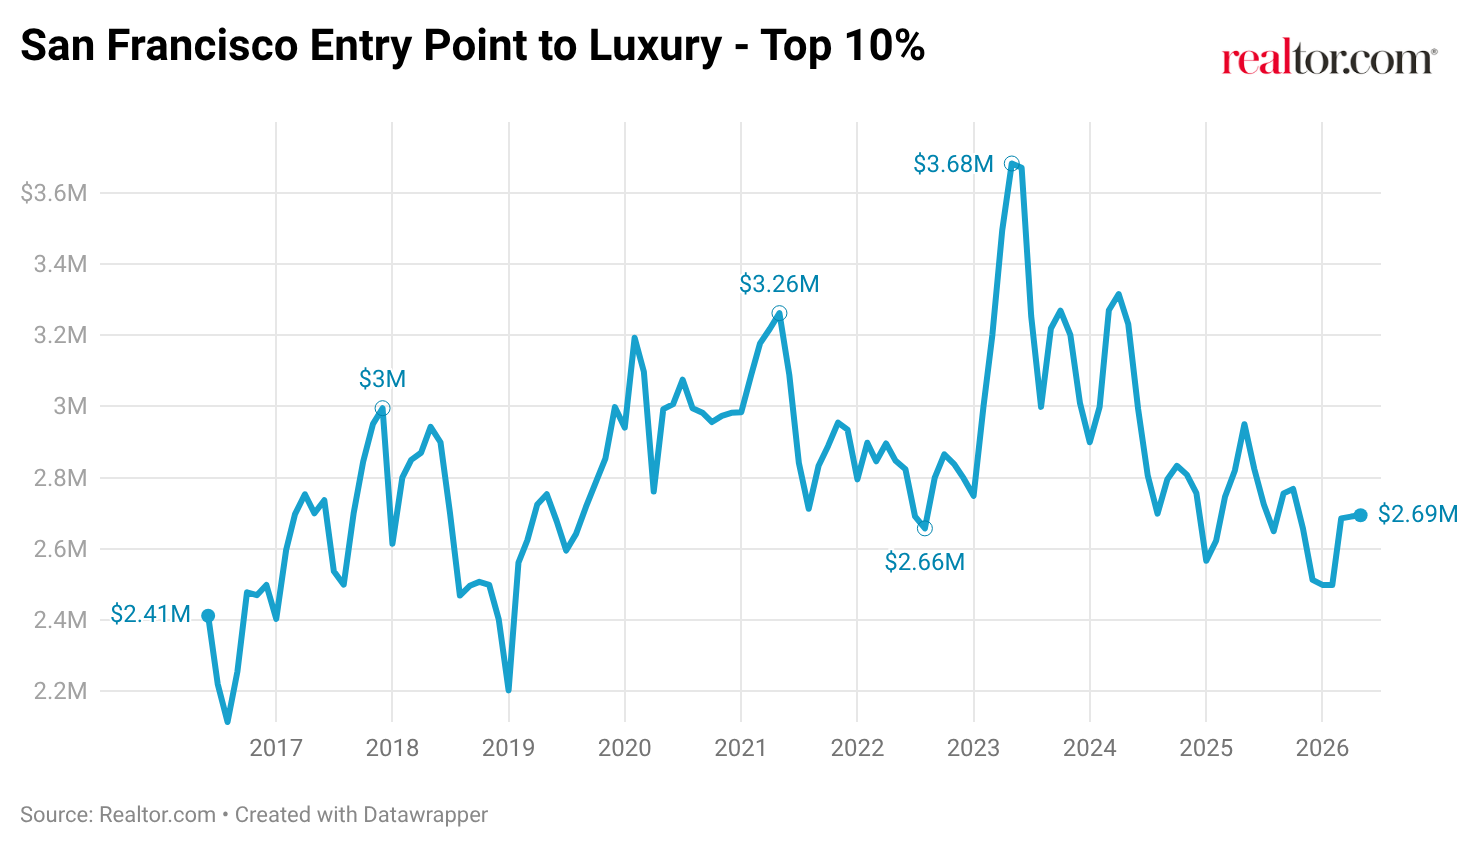
San Francisco-Oakland-Fremont, CA, sits at the extreme end of this spectrum. Its pandemic run-up was 15.3%, but the subsequent correction has not only erased those gains but also pushed the February 2026 90th-percentile price to $695K below the February 2020 baseline. The metro’s experience reflects a combination of tech-sector headcount reductions, persistent outmigration, and a luxury buyer pool that has contracted more sharply than in many other major metros. However, the same industry is starting to reshape the competitive landscape at the top of the market in ways that run counter to the broader correction. AI equity liquidity events, including employee tender offers and secondary market transactions at companies such as OpenAI, Stripe, and Databricks, have kept Bay Area luxury down payments persistently elevated above pre-pandemic norms. The recent Realtor.com report shows that the residual gap, estimated at roughly 6.6 percentage points, translates to approximately $198,000 in additional upfront cash on an entry-level Bay Area luxury home priced near $3 million. That concentration of cash buying, drawn from a relatively small but highly compensated AI workforce, introduces a counterforce to the headline price correction.

Telegraph Hill in North Beach, in San Francisco, California, USA – Getty Images
San Jose-Sunnyvale-Santa Clara, CA (-54.4%), and Denver-Aurora-Centennial, CO (-13.7%), have also fallen below their pre-pandemic baselines, joined by the two Hawaii markets: Urban Honolulu (-3.0%) and Kahului-Wailuku (-6.3%). Washington-Arlington-Alexandria, DC-VA-MD-WV, retained just 3.2% of its pandemic run-up, with February 2026 prices barely above February 2020 levels, reflecting sustained structural uncertainty around federal employment concentration in the metro.
Los Angeles-Long Beach-Anaheim, CA (28.1%), Phoenix-Mesa-Chandler, AZ (25.4%), and Seattle-Tacoma-Bellevue, WA (29.0%), each retained roughly one-quarter to three-tenths of their run-ups, placing them firmly in the lower half of the table but above the below-baseline markets. Jacksonville, FL (39.1%) marks the boundary between the two tables, having retained more than a third of its gains from a peak reached in April 2022.
All data in this report is sourced from Realtor.com® listing trends as of May 2026, reflecting active inventory of existing homes, including single-family residences, condos, townhomes, row homes, and co-ops. Listings reflect only those provided by MLS platforms to Realtor.com through a listing feed. New-construction listings are excluded unless actively listed on participating MLSs.
Luxury segmentation is based on market-specific price percentiles, with the 90th percentile representing entry-level luxury, the 95th percentile marking high-end luxury, and the 99th percentile indicating ultraluxury. All calculations are based on listing prices, not final sales prices.
Metropolitan and micropolitan areas are defined using the Office of Management and Budget’s OMB-2023 delineations, with Claritas 2025 household estimates used for relative comparisons. Where appropriate, we limited analysis to metros or micros with a minimum threshold of active million-dollar listings on average over the past year to ensure meaningful comparisons.
Historical listing trend data extends to July 2016, but year-over-year comparisons in this report use May 2025 as the baseline.
Luxury by the Numbers
90th percentile = Entry-level luxury (top 10% of prices)
95th percentile = High-end luxury
99th percentile = Ultraluxury (often rare or custom properties)
Disclaimer: The information provided on this website is for educational and informational purposes only and should not be considered financial, investment, or legal advice. Stock markets, real estate, and other financial instruments involve significant risks, and past performance does not guarantee future results. You should conduct your own research and/or seek advice from a licensed financial advisor before making any investment decisions. The website owner is not liable for any financial losses or damages arising from the use of the information presented here.