

A Growing Premium
Bend is no longer the hidden gem it once was, and hasn’t been for some time. The premium was already building well before the pandemic: in May 2017, Bend’s median listing price was $434,725, compared with $277,476 nationally, a gap of roughly 57%. That premium has only widened. As of May 2026, Bend’s median listing price reached $709,900 compared with $429,500 nationally, pushing the gap to about 65%.
The divide is more dramatic at the top of the market. Nationally, the entry point for the top 10% of listings was $852,531 in May 2017, and has since risen roughly 50% to about $1.28 million. Bend’s luxury threshold started just above the national mark at $997,450 in May 2017, and has since climbed more than 80% to roughly $1.8 million. The Bend metro has jumped roughly 20 spots in terms of most expensive luxury markets since 2017.
Pandemic Boom
Pandemic boomtowns experienced some of the sharpest luxury price growth in the country, fueled by a flood of demand from buyers in pricier metros chasing lower costs, a higher quality of life, and often a recreational draw. Nationally, luxury prices rose roughly 50% from pre-pandemic levels to their peak. But many of these boomtowns have since given back a meaningful share of those gains. Denver saw its luxury threshold climb nearly 33% at the peak, only for prices to fall below not just the pandemic high, but pre-pandemic levels entirely. Bend, Oregon, saw an even steeper run-up, with luxury prices climbing more than 67%, yet it has held onto 89% of those gains, a sharp contrast to many other markets.
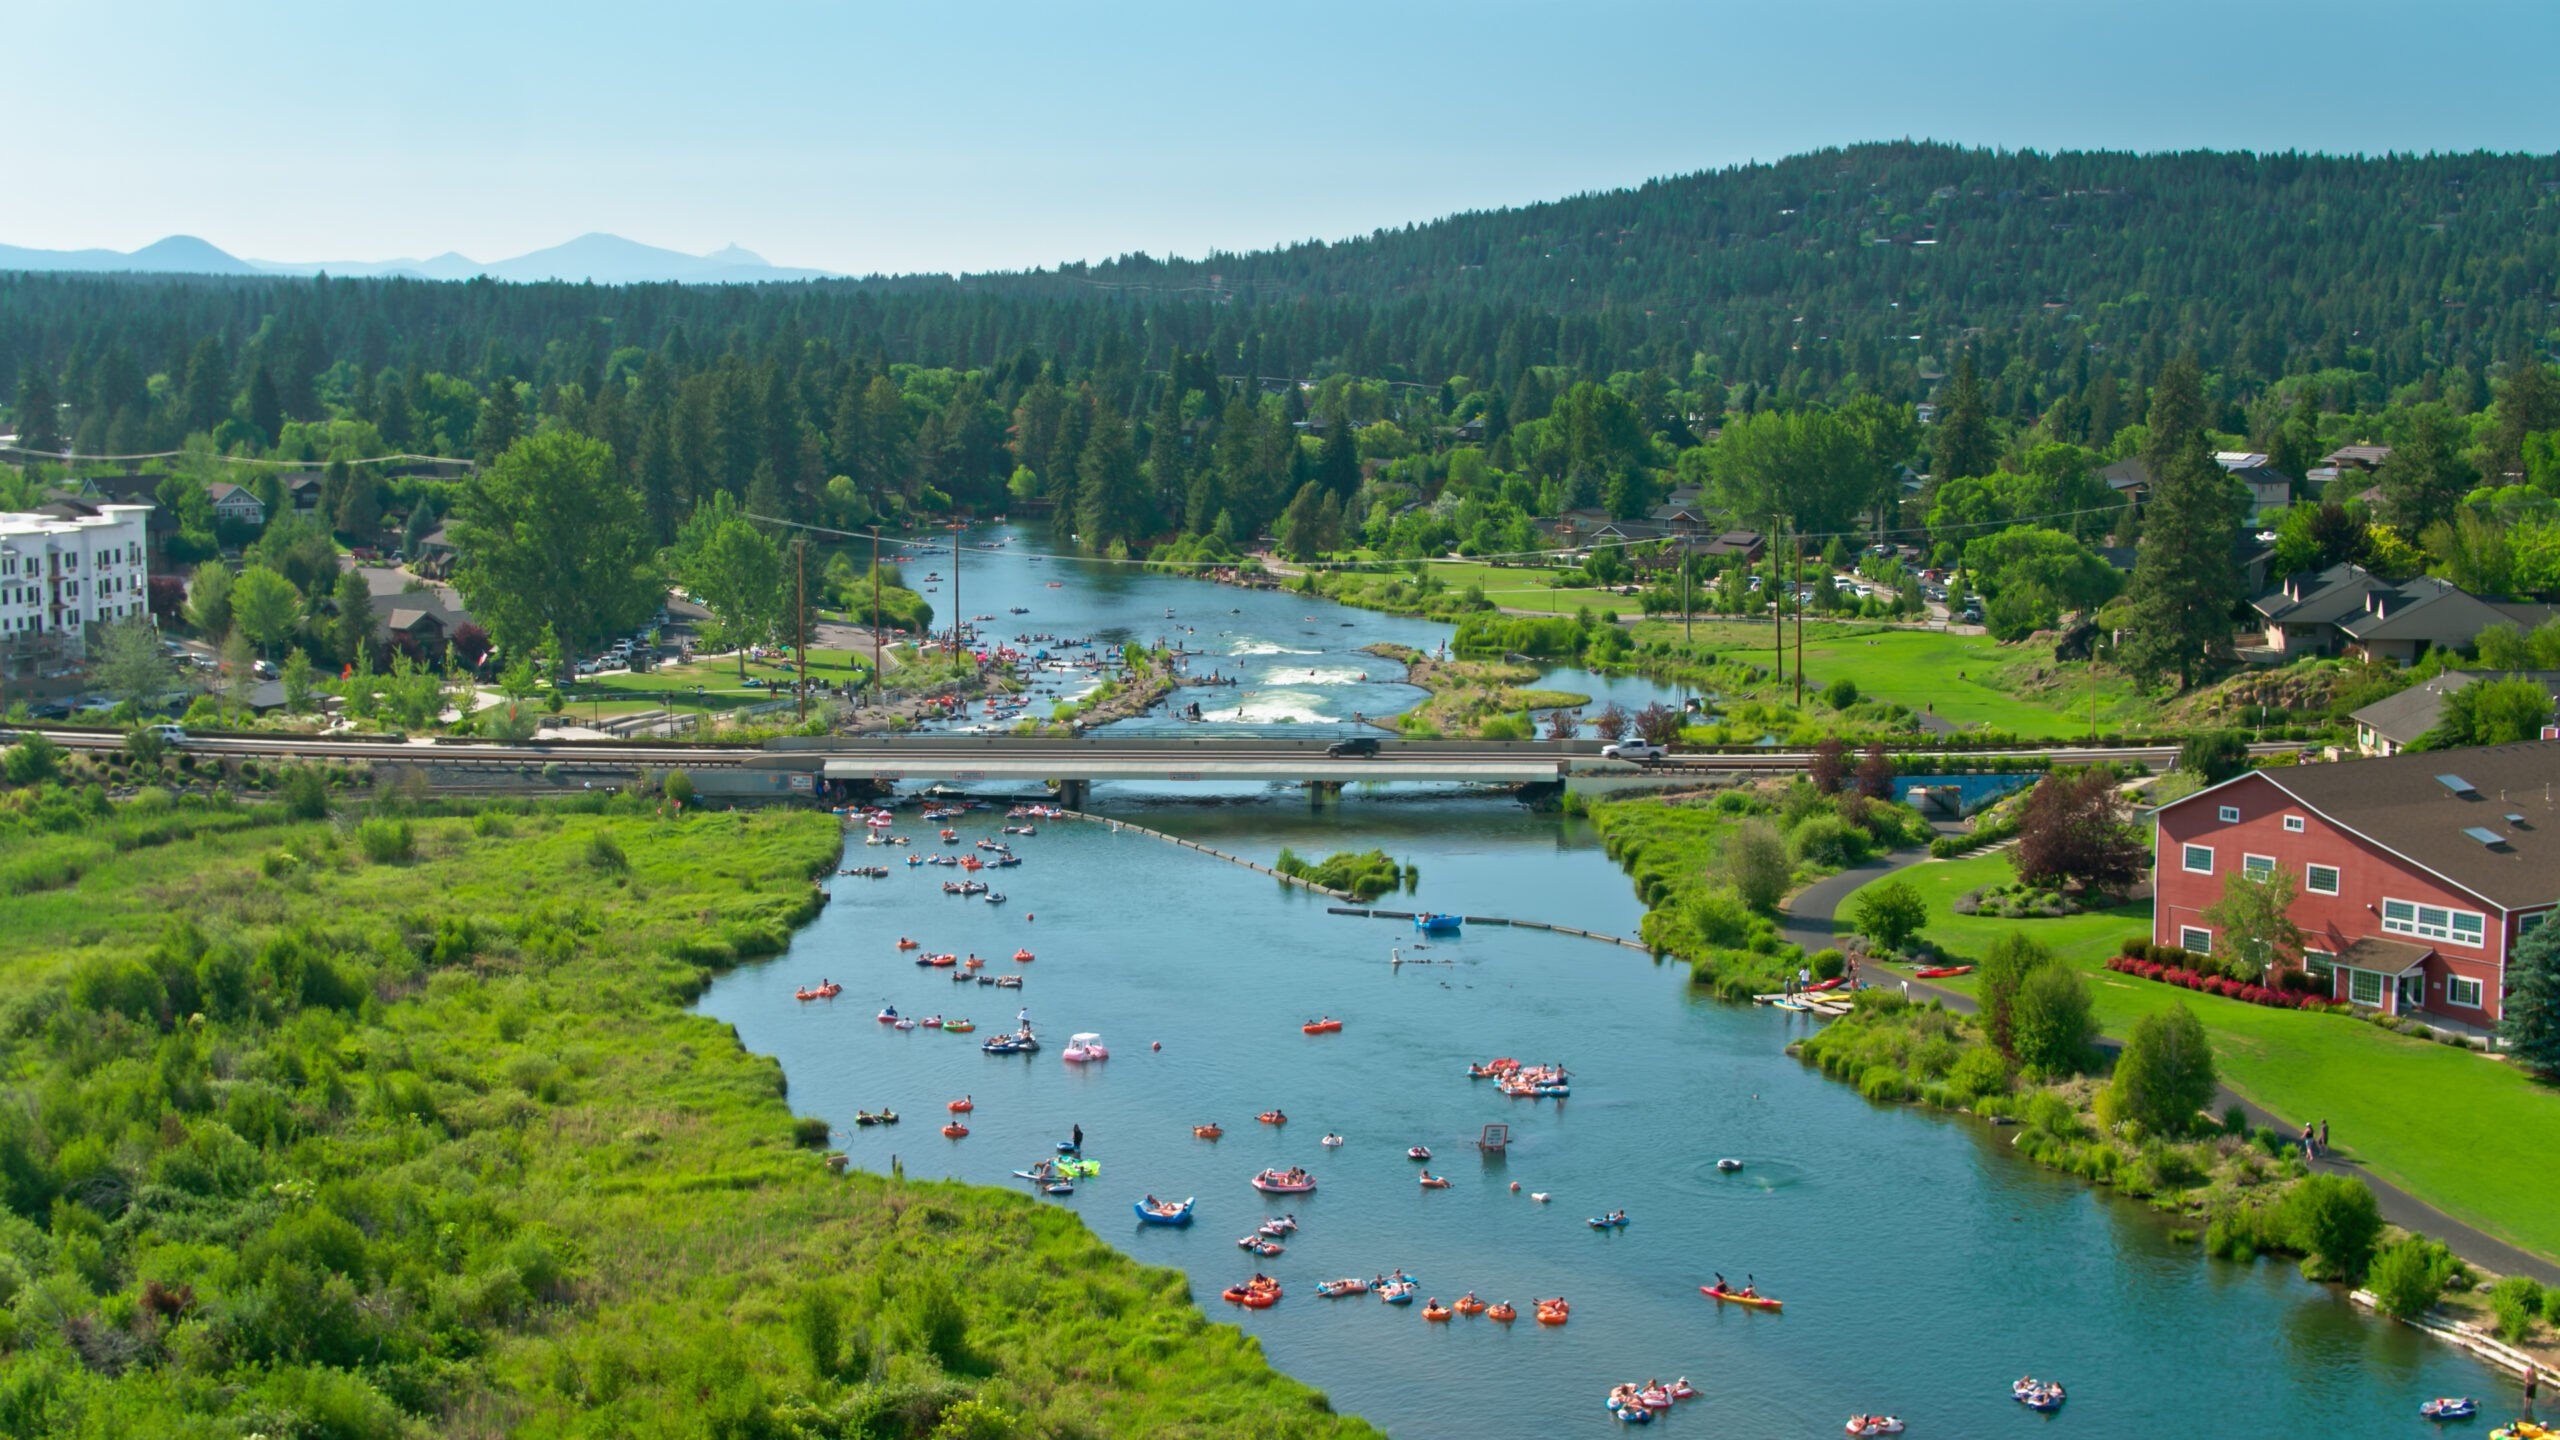
Deschutes River Bend, Oregon – Getty Images
Recreational Dream
Bend’s draw isn’t built around commerce. It’s a recreational dream for outdoor lovers looking to trade big-city life for hiking and biking trails, water activities, a thriving brewery scene, and a close-knit community where you’re far more likely to know your neighbors than in a larger metro.
Bend sits in an interesting category. It has grown substantially since the pandemic, similar to Boise, Idaho, and prices have surged, but in the scope of recreational getaways, it’s not quite at the level of Heber, UT, or Bozeman, Montana. It’s a level lower in terms of pricing, while still offering some of the best recreational opportunities in the country.
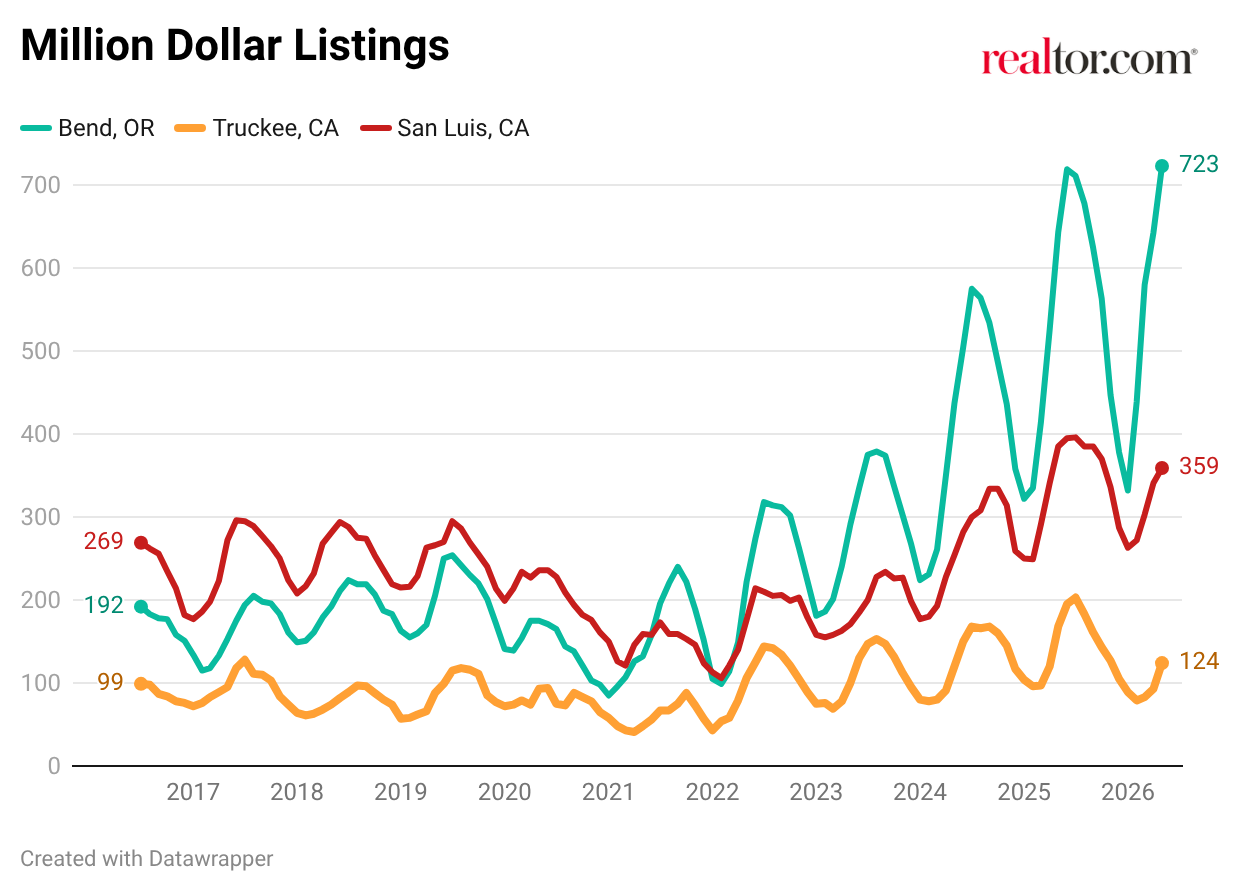
Being a smaller market means Bend can see more price volatility, but it has also posted a bigger surge in million-dollar properties than similarly sized markets did pre-pandemic. Truckee, California, another small-town recreational market, and San Luis Obispo, which was a larger market, have both been outpaced by Bend in million-dollar property growth.
East vs. West
Bend’s identity is built around the outdoors, but within that lies a subtle rivalry between its east and west sides. The dividing line is Highway 97, reinforced by the Bend Parkway. It’s less about which side is objectively better than a matter of preference, though the two have developed distinct characteristics.
West Bend runs along the slopes of the Cascades with dense ponderosa pine, direct access to the Deschutes River, and the shortest commute to Mt. Bachelor and the Cascade Lakes Highway. It also has plenty of amenities, including the downtown area, the popular Old Mill District, and most of the metro’s trail access. The concentration of amenities, combined with a hard land constraint, has meaningfully pushed prices higher here.
East Bend trades pine forest for high desert, and often delivers wider mountain views thanks to fewer trees and less topography in the way. Price points in East Bend are typically lower, and homes are relatively more affordable, with sprawling neighborhoods and more room to expand compared to West Bend.
The differences between East and West Bend run deeper than location, geography, and views. West Bend has taken on the identity of where new arrivals and tourists tend to land, and the rivalry has grown more cultural than geographic: longtime locals who remember Bend’s quieter neighborhoods and more of a small town feel on the East, newer residents who’ve fueled much the growth of its high-end suburbs in the West.. It’s a familiar tension in any place that’s grown this fast.
| Area | Property Count | Median Listing Price | Median Listing Price YoY |
| Old Bend | 15 | $1,345,000 | 41.7% |
| Century West | 50 | $1,095,000 | 0.0% |
| Aubrey Butte | 82 | $1,299,999 | -3.3% |
| Summit West | 72 | $1,112,500 | -13.3% |
| River West | 55 | $947,000 | -5.3% |
| Southwest Bend | 44 | $774,500 | 9.3% |
| Southern Crossing | 27 | $875,000 | -21.7% |
| Larkspur | 40 | $614,450 | 5.8% |
| Southeast Bend | 27 | $754,000 | -1.4% |
| Old Farm District | 65 | $654,995 | -8.1% |
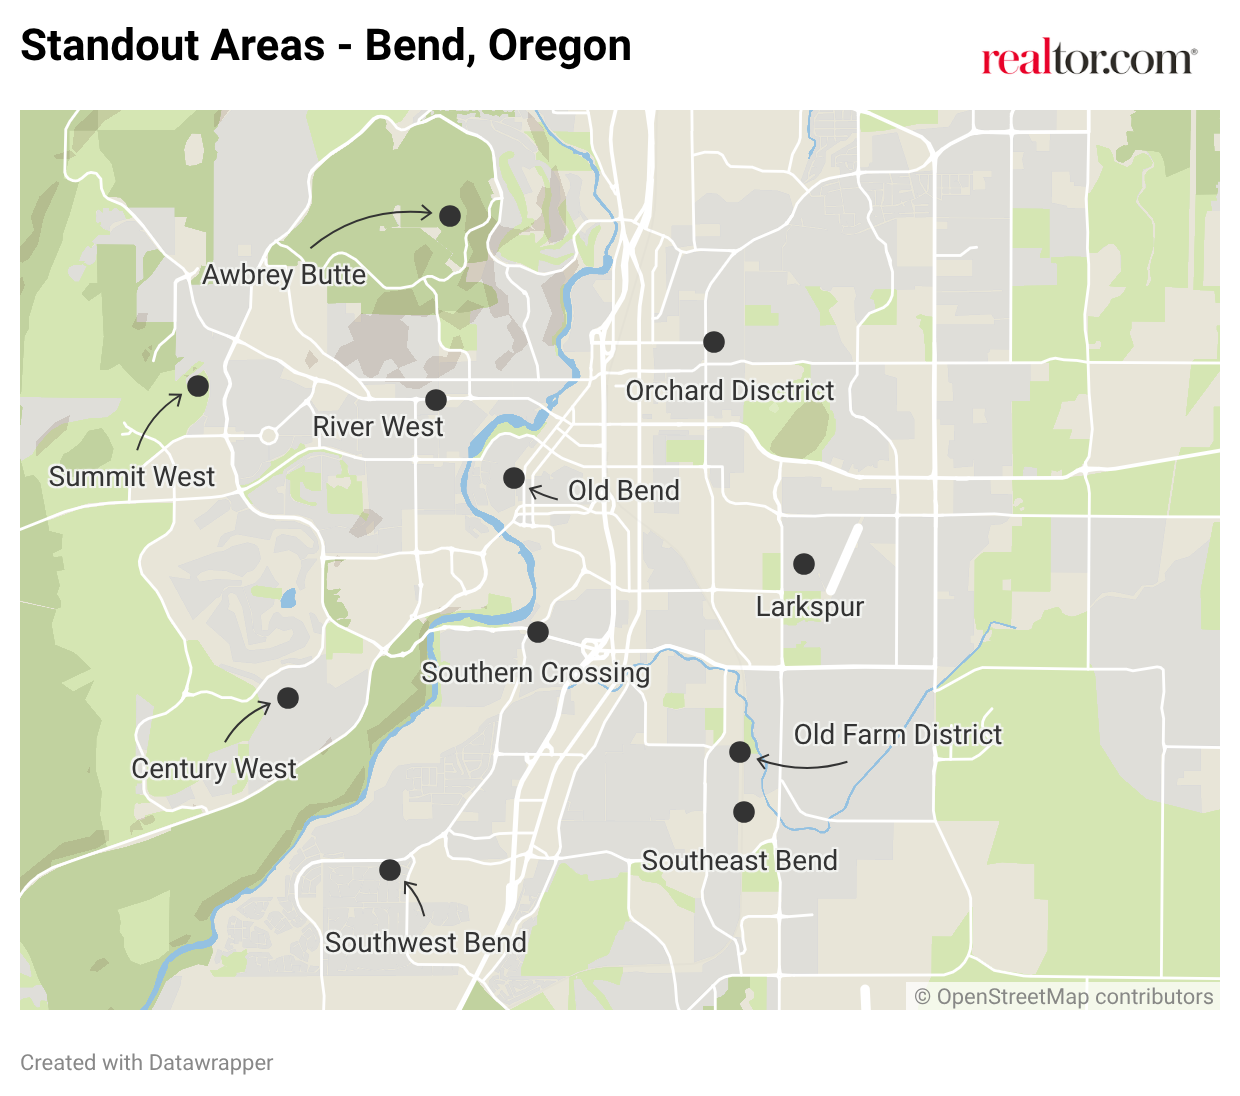
The price point difference in neighborhoods is clear, with 7 of the top 10 Bend neighborhoods located in the west. Old Bend has the highest median listing price, coming in at roughly $1.35 million. Homes here can quickly reach over $3 million.
Awbrey Butte follows close behind at $1.3 million, but stands out for depth rather than ceiling: 79% of its listings are priced above $1 million, the highest million-dollar concentration of any neighborhood in Bend. Summit West and Century West round out the top four, both clearing $1.09 million, while River West, Southern Crossing, and Southwest Bend fill out the rest of the west’s showing, ranging from $774,500 to $947,000.
Price per square foot tells a different story than median price alone. Old Bend commands $767 per square foot, more than 70% above Awbrey Butte’s $451, despite Awbrey Butte’s higher raw price tag, a reflection of Old Bend’s smaller, more historic lots close to downtown versus Awbrey Butte’s larger, newer builds.
The east side’s strongest showings, Southeast Bend, Orchard District, and Old Farm District, land between $655,000 and $754,000, roughly half of Old Bend’s median. Notably, none of Southeast Bend’s active listings currently top $1 million. Just outside the top 10, Larkspur offers one of the more accessible entry points into the Bend market at $614,450, without giving up much in the way of recreation access near Pine Nursery Park.
Next Chapter
Bend’s story is one of retention rather than reversal. While some pandemic boomtowns gave back their gains entirely, Bend held onto the vast majority of its run-up, a sign that the demand driving its luxury market wasn’t a pandemic fluke but a lasting reassessment of what buyers are willing to pay for mountain access, small-town character, and a quality of life larger metros can’t replicate. That demand hasn’t distributed evenly. It’s concentrated hardest in the built-out, amenity-rich west side, while the east side absorbs the metro’s growth and offers the more attainable way into the market. Whether that gap widens or narrows in the years ahead, one thing is clear: Bend has firmly left “hidden gem” status behind.
Methodology
All data in this report is sourced from Realtor.com® listing trends as of May 2026, reflecting active inventory of existing homes, including single-family residences, condos, townhomes, row homes, and co-ops. Listings reflect only those provided by MLS platforms to Realtor.com through a listing feed. New-construction listings are excluded unless actively listed on participating MLSs.
Luxury segmentation is based on market-specific price percentiles, with the 90th percentile representing entry-level luxury, the 95th percentile marking high-end luxury, and the 99th percentile indicating ultraluxury. All calculations are based on listing prices, not final sales prices.
Metropolitan and micropolitan areas are defined using the Office of Management and Budget’s OMB-2023 delineations, with Claritas 2025 household estimates used for relative comparisons. Where appropriate, we limited analysis to metros or micros with a minimum threshold of active million-dollar listings on average over the past year to ensure meaningful comparisons.
Historical listing trend data extends to July 2016, but year-over-year comparisons in this report use May 2025 as the baseline.
Luxury by the Numbers
90th percentile = Entry-level luxury (top 10% of prices)
95th percentile = High-end luxury
99th percentile = Ultraluxury (often rare or custom properties)
Disclaimer: The information provided on this website is for educational and informational purposes only and should not be considered financial, investment, or legal advice. Stock markets, real estate, and other financial instruments involve significant risks, and past performance does not guarantee future results. You should conduct your own research and/or seek advice from a licensed financial advisor before making any investment decisions. The website owner is not liable for any financial losses or damages arising from the use of the information presented here.
About The Author


